NE, MN, UT, MT Paycheck Tax Guide 2025-26
Nebraska, Minnesota, Utah, and Montana tax wages differently. Take-home pay at $50K, $75K, $100K plus Montana's 2024 reform. No signup.
Four states, four different tax structures. Nebraska uses a progressive 4-bracket system topping out at 5.84%. Minnesota has the highest rate of the group at 9.85% on income above $183,340. Utah applies a flat 4.55% but then subtracts an $878 personal exemption credit from the computed tax. Montana overhauled its entire rate structure in 2024, replacing a 7-bracket system with just 2 brackets.
If you are comparing these states for a job offer or a move, the calculators do the math with your exact numbers: Nebraska Paycheck Calculator, Minnesota Paycheck Calculator, Utah Paycheck Calculator, Montana Paycheck Calculator. This guide shows what the numbers look like side by side.
State Income Tax Rates: All Four States
Nebraska 2025-26 (single filer brackets after standard deduction):
| Taxable Income | Rate |
|---|---|
| Up to $3,440 | 2.46% |
| $3,441 to $20,730 | 3.51% |
| $20,731 to $33,420 | 5.01% |
| Over $33,420 | 5.84% |
Nebraska also provides a personal exemption credit: $142 for single filers, $284 for married filing jointly. This reduces tax owed directly, not taxable income. For married filers, the bracket thresholds roughly double.
Minnesota 2025-26 (single filer brackets):
| Taxable Income | Rate |
|---|---|
| Up to $30,070 | 5.35% |
| $30,071 to $98,760 | 6.80% |
| $98,761 to $183,340 | 7.85% |
| Over $183,340 | 9.85% |
Minnesota has no personal exemption credit. Every dollar of taxable income above zero is taxed from the first bracket, starting at 5.35%.
Utah 2025-26:
Utah applies a flat 4.55% rate to taxable income, then subtracts an $878 personal exemption credit from the resulting tax:
Utah Tax = (Taxable Income x 0.0455) - $878
This credit structure makes Utah much cheaper than its 4.55% headline rate suggests, particularly at lower and middle incomes.
Montana 2025-26 (after 2024 reform):
| Taxable Income | Rate |
|---|---|
| Up to $20,080 (single) | 4.70% |
| Over $20,080 (single) | 5.90% |
Married filer thresholds: up to $40,160 at 4.70%, above $40,160 at 5.90%. The old Montana system had 7 brackets from 1% to 6.9%. The 2024 reform consolidated everything into 2 brackets.
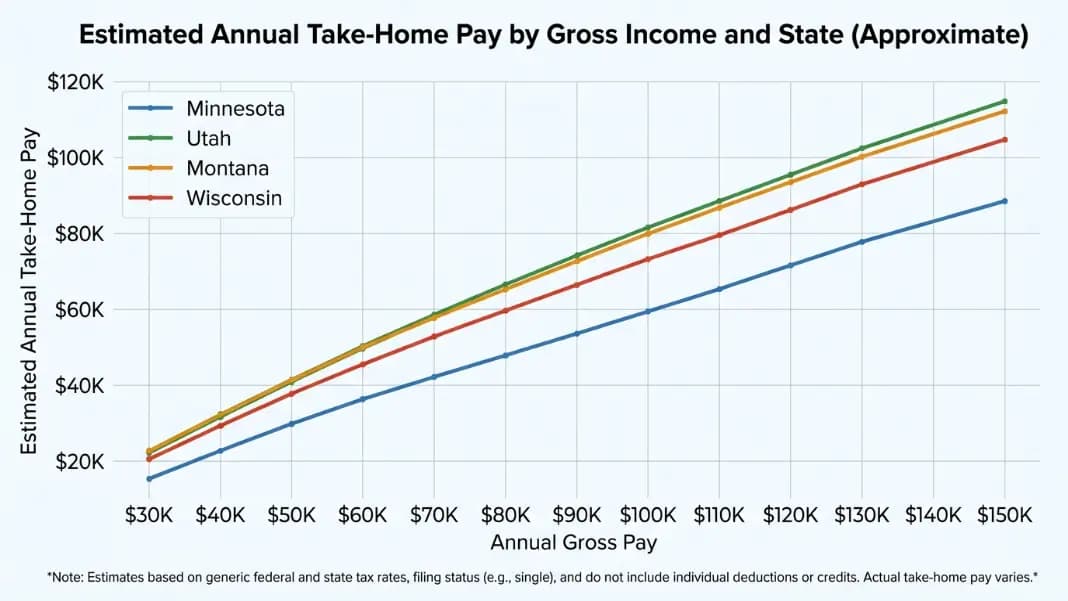
Take-Home Pay at $50K, $75K, and $100K
These figures use 2025-26 rates, single filing status, no pre-tax deductions. State tax is applied after the federal standard deduction ($15,000 for single filers in 2025). Federal taxes use the actual 2025 brackets. FICA is 7.65% on all wages.
At $50,000 gross salary:
| State | Annual State Tax | Effective State Rate | Annual Take-Home |
|---|---|---|---|
| Nebraska | $1,780 | 3.56% | $38,120 |
| Minnesota | $2,234 | 4.47% | $37,666 |
| Utah | $1,415 | 2.83% | $38,485 |
| Montana | $1,769 | 3.54% | $38,131 |
Utah has the lowest state tax burden at $50K. The $878 credit eliminates a large portion of the 4.55% flat tax at this income level. Minnesota costs $819 more per year in state taxes than Utah. Nebraska and Montana are nearly identical.
At $75,000 gross salary:
| State | Annual State Tax | Effective State Rate | Annual Take-Home |
|---|---|---|---|
| Nebraska | $3,278 | 4.37% | $55,622 |
| Minnesota | $4,082 | 5.44% | $54,818 |
| Utah | $2,717 | 3.62% | $56,183 |
| Montana | $2,733 | 3.64% | $56,167 |
The Utah and Montana gap has closed to just $16 annually at $75K. They produce essentially identical take-home pay. Minnesota now costs $1,365 more per year in state taxes than Utah.
At $100,000 gross salary:
| State | Annual State Tax | Effective State Rate | Annual Take-Home |
|---|---|---|---|
| Nebraska | $4,803 | 4.80% | $72,497 |
| Minnesota | $5,371 | 5.37% | $71,929 |
| Utah | $3,954 | 3.95% | $73,346 |
| Montana | $3,936 | 3.94% | $73,364 |
At $100K, Utah and Montana are separated by only $18 annually. Nebraska costs $849 more per year than Utah. Minnesota costs $1,417 more than Utah in state taxes and produces the lowest take-home of the four states at every income level.
Workers in the broader upper Midwest often compare these states to Wisconsin, which has four brackets but a $11,880 standard deduction that keeps effective rates well below Minnesota for most middle incomes. The Wisconsin, South Carolina, Mississippi, and Connecticut Paycheck Tax Guide covers Wisconsin's full withholding structure alongside three other states with notably different rate approaches.
For states at the opposite end of the income tax spectrum, the Alaska, Hawaii, Idaho, and Kentucky Paycheck Tax Guide shows how Alaska's zero income tax compares to Hawaii's top rate of 11%, and how Idaho and Kentucky's 2023-2024 flat-rate reforms affected take-home pay across income levels.
How 401(k) Contributions Change the Picture
Pre-tax 401(k) contributions reduce both federal and state taxable income in all four states. Each dollar contributed lowers the income entering the state tax calculation.
At $100K gross salary with a 6% 401(k) contribution ($6,000):
| State | Tax Without 401k | Tax With 401k | Annual State Tax Savings |
|---|---|---|---|
| Nebraska | $4,803 | $4,452 | $351 |
| Minnesota | $5,371 | $4,964 | $407 |
| Utah | $3,954 | $3,680 | $274 |
| Montana | $3,936 | $3,583 | $353 |
Minnesota residents save the most in state taxes from 401(k) contributions in dollar terms because their marginal rate is higher (6.80% at this income level). The benefit grows larger for Minnesota earners in the 7.85% and 9.85% brackets.
At $200K in Minnesota (top bracket), a $23,000 401(k) contribution saves approximately $2,266 in state taxes alone on top of federal savings. Maxing out pre-tax retirement accounts is especially valuable in a high-rate state.
Utah's $878 Credit vs Colorado's 4.40% Flat Rate
Utah has a higher stated rate than Colorado (4.55% vs 4.40%) but produces lower state taxes for virtually all earners because of the $878 personal exemption credit.
Comparison at key incomes (single filer):
| Gross Salary | Utah State Tax | Colorado State Tax | Utah Saves |
|---|---|---|---|
| $40,000 | $815 | $1,100 | $285 |
| $65,000 | $1,415 | $2,218 | $803 |
| $100,000 | $3,954 | $3,740 | Utah costs $214 more |
| $150,000 | $6,498 | $5,940 | Utah costs $558 more |
Utah is cheaper below roughly $95,000-$100,000 gross. Above that level, Colorado's lower rate wins because the $878 credit is the same regardless of income, so its percentage impact shrinks as income rises. For most wage earners comparing Utah to Colorado on taxes alone, Utah comes out ahead.
Montana's 2024 Reform: Who Actually Saved Money
Montana's 2024 restructuring is commonly called a tax cut, but the reality splits along income lines.
Old Montana system (7 brackets, 1% to 6.9%):
| Taxable Income (Single) | Old Rate |
|---|---|
| Up to $3,600 | 1.0% |
| $3,601 to $6,300 | 2.0% |
| $6,301 to $9,500 | 3.0% |
| $9,501 to $13,000 | 4.0% |
| $13,001 to $16,800 | 5.0% |
| $16,801 to $21,600 | 6.0% |
| Over $21,600 | 6.9% |
Tax comparison at key gross salaries:
| Gross Salary | Old MT Tax | New MT Tax | Change |
|---|---|---|---|
| $30,000 | $674 | $724 | +$50 per year |
| $50,000 | $1,723 | $1,769 | +$46 per year |
| $65,000 | $2,805 | $2,733 | -$72 per year |
| $100,000 | $4,864 | $3,936 | -$928 per year |
| $150,000 | $8,670 | $7,748 | -$922 per year |
Workers earning below roughly $57,000 to $60,000 gross pay more under the new system. The old 1% to 4% brackets on lower taxable income are gone, replaced by the new 4.7% floor. Workers above $60,000 save money because the 6.9% top rate dropped to 5.9%.
If you are a Montana resident and noticed your state withholding increase after 2023, this is why. The reform benefited higher earners while modestly raising taxes on lower-income workers.
For a deeper look at each state, the standalone guides cover the full rate structures, exemptions, and take-home calculations with bracket-by-bracket detail: Minnesota Paycheck Tax Guide, Utah Paycheck Tax Guide, and Nebraska Paycheck Tax Guide. For all other state paycheck calculators alongside income tax, retirement, and financial tools, the full calculator directory lists every tool on the site.
Utah typically has the lowest state income tax burden for most incomes due to its $878 personal exemption credit applied on top of the 4.55% flat rate. At $50K, Utah's effective state rate is 2.83%. At $75K, Utah and Montana are nearly identical. Minnesota is consistently the highest of the four states at every income level. Nebraska falls between Minnesota and Utah/Montana across the income range.
On a $75,000 gross salary with single filing and no pre-tax deductions, Minnesota state income tax is approximately $4,082 per year, or a 5.44% effective rate. This reflects the 5.35% bracket on taxable income up to $30,070 and 6.80% on income above that threshold (after subtracting the 2025 standard deduction of $15,000). The Minnesota Paycheck Calculator computes the exact amount with your specific deductions and filing status.
Yes, for most incomes. Utah's 4.55% rate is higher than Colorado's 4.40%, but Utah subtracts an $878 personal exemption credit from the computed tax. At $65,000 gross (single filer), Utah tax is approximately $1,415 versus Colorado's $2,218, saving about $803 per year. Utah becomes more expensive than Colorado above roughly $95,000-$100,000 gross, where the fixed credit has less impact relative to total tax owed.
No. Workers earning below approximately $57,000-$60,000 gross actually pay slightly more under the new 2-bracket system. The old system's 1%-4% brackets on lower taxable income were eliminated; that income is now taxed at the new 4.7% floor. Workers above $60,000 gross saved money because the old 6.9% top rate dropped to 5.9%. At $100K, the savings are about $928 per year; at $30K, the cost is about $50 per year more than before.
A $6,000 pre-tax 401(k) contribution at $100K gross saves about $407 in Minnesota state taxes versus $274 in Utah. Minnesota's marginal rate at that income is 6.80% compared to Utah's 4.55%. At higher Minnesota incomes where the 7.85% or 9.85% brackets apply, the state tax savings from 401(k) contributions grow significantly. Minnesota residents at high incomes benefit more from maximizing pre-tax retirement accounts than residents of lower-rate states.
Nebraska uses a progressive 4-bracket system. For 2025-26 single filers: 2.46% on the first $3,440, 3.51% up to $20,730, 5.01% up to $33,420, and 5.84% above $33,420. Nebraska also provides a personal exemption credit of $142 for single filers ($284 for married), which reduces tax owed directly. Married filer brackets roughly double. The Nebraska Paycheck Calculator applies all brackets and credits to your specific salary.
Written by
Hassaan Rasheed
Web Developer & Content Researcher
Hassaan builds calculators and writes research-backed guides on finance, math, payroll, and construction topics. Every number in his articles is sourced from official data and worked through by hand.
View LinkedIn Profile