Cap Rate vs IRR: Real Estate Return Metrics Explained (2026)
Cap rate measures a property's income yield today. IRR captures total return including leverage, appreciation, and timing.
12 min readRead →
Capitalization rate measures how much income a property generates relative to its price, before any financing is applied. A higher cap rate means more income per dollar invested, but it often signals higher risk or a less desirable market. Cap rate works in both directions: you can calculate it from NOI and price, or reverse it to find the implied property value from a target rate.
NOI equals gross rental income minus a vacancy allowance (typically 5-10%) minus all operating expenses. Operating expenses include property taxes, insurance, management fees (8-10% of rent), maintenance, and landlord-paid utilities. Mortgage payments and capital expenditures are excluded because cap rate is a pre-financing metric.
You are evaluating a 4-unit building listed at $800,000. Each unit rents for $1,200 per month. You estimate 5% vacancy and $18,000 in annual operating expenses.
A 4.59% cap rate is reasonable for a major metro market where appreciation drives returns. In a secondary market where comparable multifamily properties trade at 7%, the same NOI implies a value of only $524,000, which means the $800,000 price is hard to justify unless you can raise rents or reduce expenses.
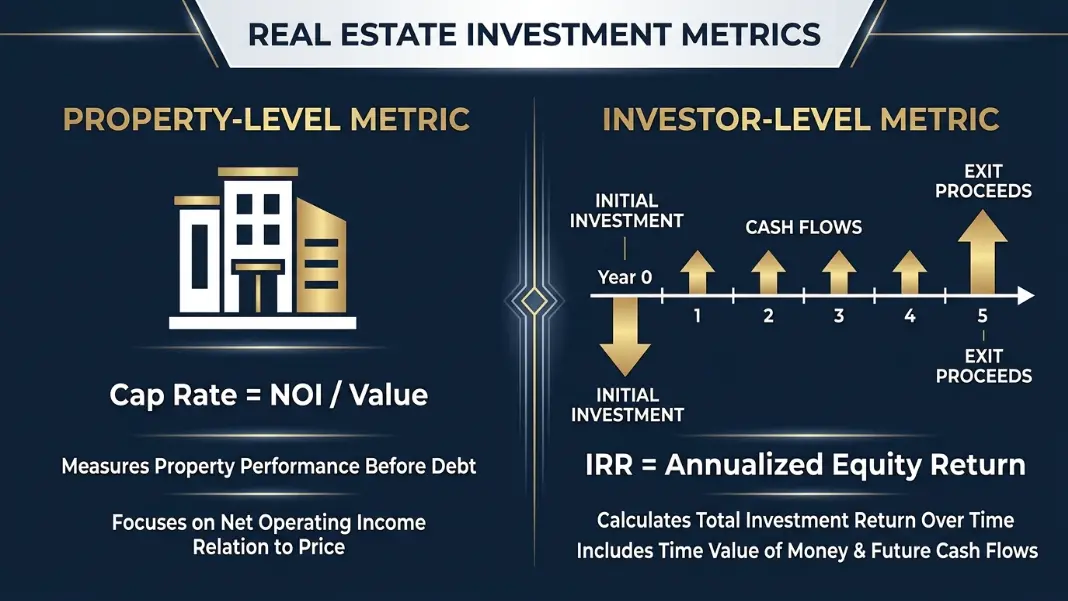
Cap rate tells you the property-level return before debt. To measure total investment return across a full hold period, pair this with the IRR Calculator, which accounts for all cash flows including the exit.
Rental properties have different cost structures depending on asset type, which directly affects your NOI and therefore your cap rate. A single-family rental and a 10-unit apartment building can have very different operating expense ratios even if their gross rents are similar.
| Property Type | Vacancy | Management | Maintenance |
|---|---|---|---|
| Single-family rental | 5-8% | 8-10% of rent | $3,000-$6,000/yr |
| Multifamily (5+ units) | 4-6% | 8-12% of rent | $800-$1,500/unit/yr |
| Short-term rental | 20-30% equiv. | 20-30% of revenue | Higher, factor in furnishings |
| Commercial / retail | 5-10% | 4-6% of rent | Varies by lease structure |
Cap rate evaluates the property before financing. Once you have your cap rate, model the debt side with the DSCR Loan Calculator to check whether property income covers mortgage payments, or use the Commercial Mortgage Calculator to model the full financing picture.
Commercial cap rates use the same formula as residential, but the NOI calculation differs based on lease structure. Triple-net (NNN) leases shift property taxes, insurance, and maintenance to the tenant, which reduces the landlord's operating expenses and makes NOI much closer to gross rent. Gross leases keep those expenses on the landlord's books, which means a higher expense load and lower NOI for the same rent.
| Asset Class | Typical Cap Rate | Lease Type | Expense Load |
|---|---|---|---|
| Industrial (prime) | 4-6% | NNN | Low (tenant pays) |
| Grocery-anchored retail | 5-7% | NNN / modified | Low to moderate |
| Office (suburban) | 6-9% | Gross or modified | High (landlord pays) |
| Net lease (single tenant) | 4-6% | NNN | Very low |
| Strip mall / inline retail | 6-8% | Modified gross | Moderate |
| Self-storage | 5-7% | Monthly | Moderate |
For larger commercial deals, lenders focus on the debt service coverage ratio rather than cap rate when sizing loans. Use the DSCR Loan Calculator to check whether your NOI comfortably covers the projected debt service.
Cap rate and ROI are often used interchangeably, but they measure very different things. Cap rate is a property-level metric that treats the asset as if it were bought all-cash. ROI measures what you actually earn on the cash you invested, including the effect of leverage, loan paydown, and appreciation when you sell.
| Metric | What It Measures | Includes Financing? | Best Used For |
|---|---|---|---|
| Cap Rate | Income yield on property value | No | Comparing properties and markets |
| Cash-on-Cash Return | Annual cash flow on equity invested | Yes (debt service) | Year 1 cash return after mortgage |
| ROI | Total return on capital invested | Yes (full picture) | Total deal performance at exit |
| IRR | Time-weighted return over hold period | Yes (all cash flows) | Multi-year investment comparison |
A 5% cap rate deal bought with 75% financing at 7% interest will produce a very different ROI than the same deal bought all-cash. The cap rate stays constant in both cases because it only looks at property income relative to price. Cash-on-cash return and IRR are where the effect of leverage shows up.
For a full picture of investment performance over a multi-year hold, use the IRR Calculator alongside this cap rate tool.
Researches and verifies the formulas, methodology, and source data behind each calculator on CalculatorFlux. All tools are built and checked against the cited references before publication.
In-depth guides related to this calculator.