Cap Rate vs IRR: Real Estate Return Metrics Explained (2026)
Cap rate measures income yield today. IRR captures total return with timing. How to calculate both and when each applies to a real estate deal.
Cap rate and IRR both measure real estate investment returns, but they answer different questions. Cap rate tells you what a property earns today relative to its price, with no consideration of financing, appreciation, or time. IRR tells you the annualized return on your actual cash invested over the full holding period, including sale proceeds and the impact of every cash flow's timing.
Relying only on cap rate misses how leverage, appreciation, and exit timing affect your real return. Relying only on IRR makes it hard to compare properties on a consistent, financing-neutral basis. Serious investors use both. This article explains how to calculate each metric, when to use each one, and what the benchmarks look like across property types.
The Cap Rate Calculator and the IRR Calculator handle the math. Understanding what each metric does and does not tell you is what makes the numbers useful.
How Cap Rate Is Calculated
Cap rate (capitalization rate) is the ratio of a property's net operating income to its current market value. It is always calculated on an unleveraged basis, meaning it ignores the mortgage entirely.
Cap Rate = Net Operating Income / Property Value
Net Operating Income (NOI) = Gross rental income minus vacancy losses minus operating expenses. Operating expenses include property taxes, insurance, maintenance, property management fees, and reserves. They do not include mortgage payments or depreciation.
Worked example:
- Property value: $800,000
- Annual gross rent: $72,000
- Vacancy allowance (5%): $3,600
- Operating expenses (property tax, insurance, maintenance, management): $18,000
- NOI = $72,000 - $3,600 - $18,000 = $50,400
- Cap Rate = $50,400 / $800,000 = 6.3%
This 6.3% cap rate says: for every dollar of property value, the property generates 6.3 cents in annual net income before financing costs. It tells you nothing about your down payment, loan terms, or what happens at sale.
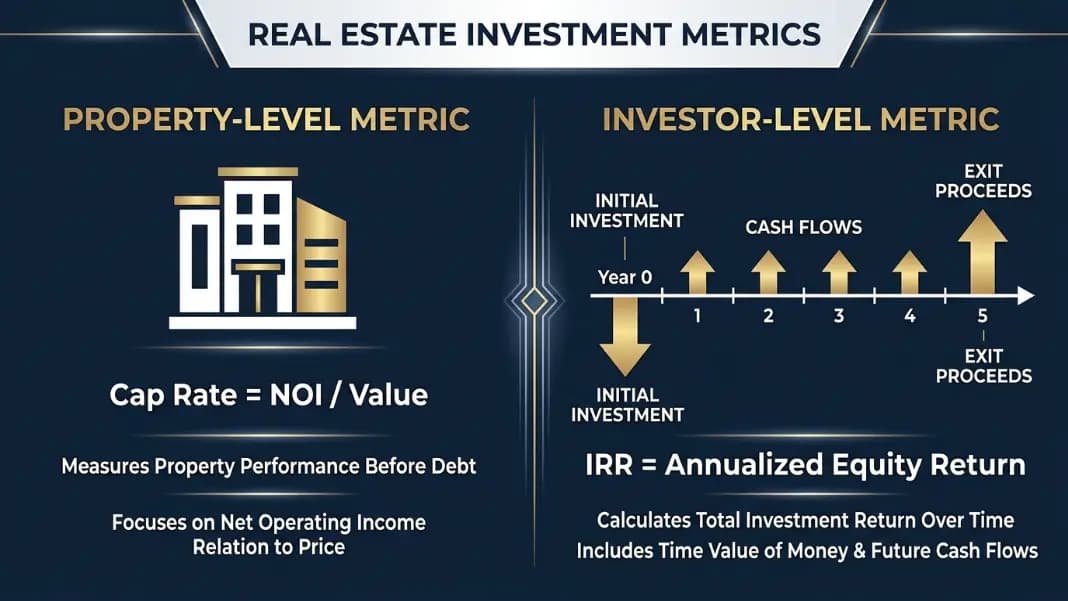
Cap rate is a property-level snapshot. It measures income performance at a single point in time, independent of how any particular buyer finances the purchase. That independence is its primary value: it puts every property on the same footing for comparison, regardless of deal structure.
Two properties can have very different IRRs for the same investor while showing identical cap rates, simply because of different financing terms, hold periods, or exit prices.
How IRR Is Calculated for Real Estate
IRR (internal rate of return) is the discount rate that makes the net present value (NPV) of all cash flows equal to zero. In practical terms: it is the annualized return on your actual equity invested, accounting for every dollar that went in and every dollar that came back out, adjusted for when each occurred.
0 = -Equity + CF1/(1+IRR) + CF2/(1+IRR)^2 + ... + (CFn + Net Sale Proceeds)/(1+IRR)^n
There is no closed-form algebraic solution. IRR is found through iteration, which is why calculators and spreadsheet functions (=IRR in Excel) are standard.
Worked example (5-year hold on the same $800,000 property):
- Down payment (30%): $240,000
- Annual net cash flow after mortgage payments: $9,500/year (years 1 to 5)
- Sale price at year 5: $940,000
- Remaining loan balance at sale: $520,000
- Net sale proceeds after paying off loan: $420,000
Cash flows from the investor's perspective:
| Year | Cash Flow |
|---|---|
| 0 | -$240,000 (initial equity) |
| 1 | +$9,500 |
| 2 | +$9,500 |
| 3 | +$9,500 |
| 4 | +$9,500 |
| 5 | +$9,500 + $420,000 = $429,500 |
IRR on these cash flows is approximately 13.7%.
Compare that to the 6.3% cap rate on the same property. The difference comes from three sources: leverage (the mortgage amplifies equity returns), appreciation (the property sold for more than it was purchased for), and timing (sale proceeds arriving in year 5 are discounted less than income earned in year 10 would be).
Cap rate would be the same for any buyer of this property. IRR changes depending on how much equity you put in, your loan terms, how long you hold, and what you sell for.
Cap Rate vs IRR: When Each Metric Applies
The choice between cap rate and IRR depends entirely on what you are trying to measure.
| Question | Metric to Use |
|---|---|
| How does this property compare to others right now? | Cap rate |
| Is this property priced fairly for its income? | Cap rate |
| What is my actual return on invested equity? | IRR |
| How does financing affect my return? | IRR |
| Should I sell now or hold 3 more years? | IRR |
| What happens to returns if exit cap rate expands? | IRR |
| Comparing two deals with different financing structures? | IRR |
Cap rate is a screening tool and a valuation anchor. Use it to filter deals quickly and to check whether the asking price is reasonable relative to the income the property generates. If a property trades at a 4.2% cap rate in a market where comparable properties trade at 5.8%, you need a specific reason for that premium.
IRR is a decision tool for the specific deal in front of you. Once a property passes the cap rate screen, build out the full cash flow model with your actual financing terms, projected rent growth, expense assumptions, and exit scenario. The resulting IRR is what you are actually earning on your equity.
The two metrics complement each other. Neither replaces the other.
Cap Rate and IRR Benchmarks by Property Type (2026)
These are approximate targets used by institutional and experienced private investors. Actual results vary by market, submarket, asset quality, and deal structure.
| Property Type | Typical Cap Rate Range | Target Levered IRR |
|---|---|---|
| Core multifamily (stabilized) | 4.5-5.5% | 8-12% |
| Value-add multifamily | 5.0-6.5% | 14-18% |
| Class A office (major markets) | 5.0-6.5% | 8-12% |
| Retail (anchored, grocery) | 6.0-7.5% | 10-14% |
| Industrial / logistics | 4.5-5.5% | 10-14% |
| Single-family rental | 5.0-7.0% | 10-16% |
| Opportunistic / ground-up development | N/A at acquisition | 18-25%+ |
| Net lease (investment grade tenant) | 4.0-5.0% | 7-10% |
These ranges shift with interest rates. When the 10-year Treasury yield rises, real estate cap rates tend to follow, because investors demand higher income yields relative to the risk-free rate. A 50 basis point rise in cap rates on an $800,000 property drops the implied value by roughly $60,000 to $70,000, all else equal.
IRR targets for levered deals are particularly sensitive to borrowing costs. A deal that projects 15% IRR at 6% loan interest may project only 10% IRR at 7.5% interest, with the same operating performance. Financing assumptions matter as much as the property itself.
The Commercial Mortgage Calculator lets you model different loan terms, LTV ratios, and interest rates so you can see how debt structure affects levered IRR before committing to a deal.
How to Use Both Metrics Together
A complete acquisition analysis uses cap rate and IRR at different stages of the evaluation process.
Stage 1: Filter with cap rate Compare the going-in cap rate to market cap rates for the same asset class and submarket. A property with a 4.0% cap rate in a 6.0% cap market needs an explanation. Possible reasons: rent significantly below market (value-add upside), development potential, or strong market rent growth expectations. Without a clear explanation, the price is too high for the income it generates today.
Stage 2: Build the IRR model Once the cap rate screen is passed, build a detailed cash flow projection for your specific structure: actual down payment, loan terms, projected NOI growth (typically 2% to 3% per year for stable assets), and a target exit in 5 to 7 years. Calculate IRR using your projected net sale proceeds.
Step 3: Stress-test the exit Model two scenarios beyond your base case: one where rent growth is flat and the property sells at a higher cap rate (lower price), and one where expenses rise 15% from baseline. If the IRR holds above your hurdle rate in both stress cases, the deal has meaningful margin.
Step 4: Compare IRR to your hurdle rate Your hurdle rate is the minimum acceptable return given the risk of the deal and your cost of equity. If your hurdle is 12% and the base case projects 11.5%, the deal does not clear the bar. If the stress case shows 8%, you understand the downside. A deal can look attractive on cap rate and still fail the IRR screen once leverage, timing, and realistic exit assumptions are modeled.
A property can have a strong cap rate but weak IRR if the leverage terms are unfavorable. It can also show a low cap rate but a strong IRR if rent growth and appreciation are significant. Neither metric alone tells the full story of an investment's performance.
When the comparison moves beyond a single deal to evaluating two investments of different sizes or cash flow timing, IRR can give misleading rankings that NPV corrects. The IRR vs NPV Guide covers the four scenarios where the two metrics conflict and which one to trust for each type of decision.
Yes. A property with a 6.5% cap rate purchased at 80% LTV with high-cost debt may produce very little annual cash flow after mortgage payments. If it also appreciates slowly or is sold into a higher-cap-rate market (lower exit price), the IRR on invested equity can fall below 8% despite a solid going-in cap rate. IRR accounts for financing costs, timing, and exit value; cap rate accounts for none of these. Always model both.
It depends on asset class and market. Stabilized multifamily in primary metros typically trades at 4.5% to 5.5%. Secondary markets and value-add deals generally require 6% or higher to justify the risk. Industrial properties in high-demand logistics corridors often trade below 5% due to strong rent growth expectations. A useful benchmark: the cap rate should exceed your all-in borrowing cost by at least 50 to 100 basis points, or the deal produces negative leverage from day one.
Core institutional deals typically target 8% to 12% levered IRR. Value-add strategies target 14% to 18%. Opportunistic and development deals target 18% or higher. Single-family rental investors commonly target 10% to 16%. The threshold should be compared to your cost of equity and alternative investments available, not just to an absolute number. An IRR below your hurdle rate is a value-destroying deal regardless of how strong the cap rate looks.
Significantly. IRR is highly sensitive to the timing of cash flows. A 3-year hold with the same total profit as a 10-year hold produces a higher IRR because capital returns sooner. Conversely, a 10-year hold of an appreciating asset accumulates more total dollars but spreads the return over more periods, lowering the annualized rate. When comparing deals with different planned hold periods, IRR comparisons can be misleading. Also model total equity multiple (total proceeds divided by total invested) alongside IRR.
The going-in cap rate is calculated at the time of purchase using current NOI. The exit cap rate is the cap rate at which you assume the property will be valued when you sell. If you buy at a 5.5% cap rate and assume you will sell at a 6.0% cap rate, you are building in cap rate expansion, which means a lower sale price relative to NOI growth. This conservative assumption lowers projected IRR and is considered realistic in rising rate environments. Many deals fail when exit cap rate assumptions are too optimistic.
Yes. Use =IRR(values) where the first value is the initial equity investment as a negative number, followed by annual net cash flows, with the final year including net sale proceeds after paying off the mortgage. For deals with irregular cash flow timing, =XIRR(values, dates) is more accurate. The IRR Calculator at /irr handles the same calculation with labeled fields and can model up to 20 cash flow periods.
Written by
Hassaan Rasheed
Web Developer & Content Researcher
Hassaan builds calculators and writes research-backed guides on finance, math, payroll, and construction topics. Every number in his articles is sourced from official data and worked through by hand.
View LinkedIn Profile