IRR vs NPV: Which Metric to Use and When They Disagree (2026)
IRR and NPV often agree, but four scenarios cause them to conflict. Which to trust for scale comparisons, mutually exclusive projects, and capital allocation.
IRR and NPV are often taught together as two versions of the same analysis. They are not. They answer different questions, produce different types of answers, and when they conflict on a capital allocation decision, only one of them is pointing you toward the right choice.
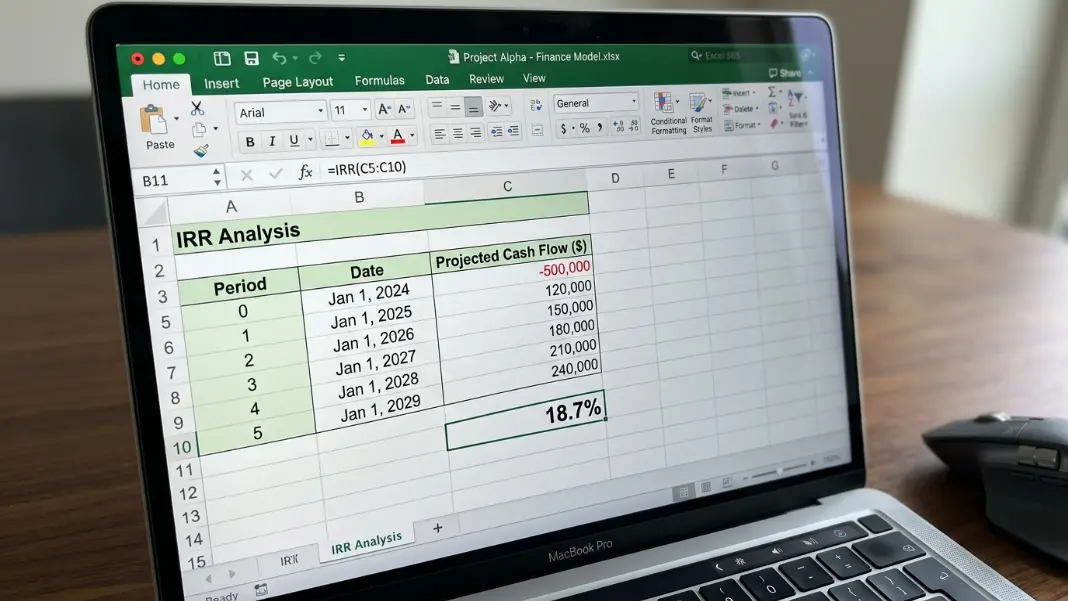
Understanding where they agree, where they diverge, and which one to use for a given decision is the practical work this post does. The IRR Calculator computes both IRR and NPV for any cash flow series, which makes it straightforward to run both checks on the same investment before committing capital.
How IRR and NPV Calculate Different Things
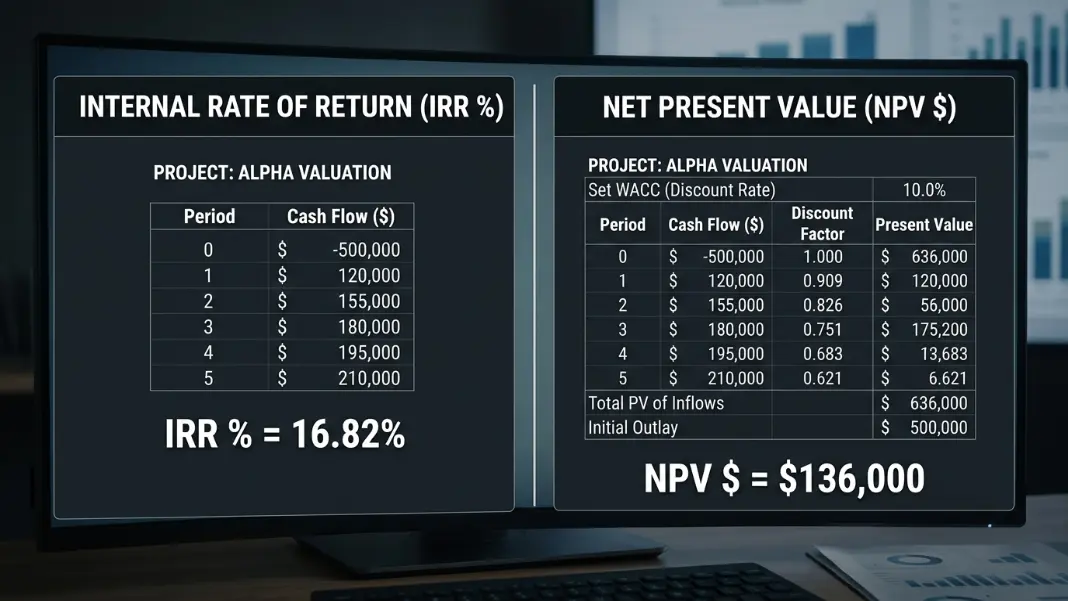
Both metrics use discounted cash flow analysis. Both work from the same inputs: an initial investment and a series of future cash flows. The difference is what they solve for.
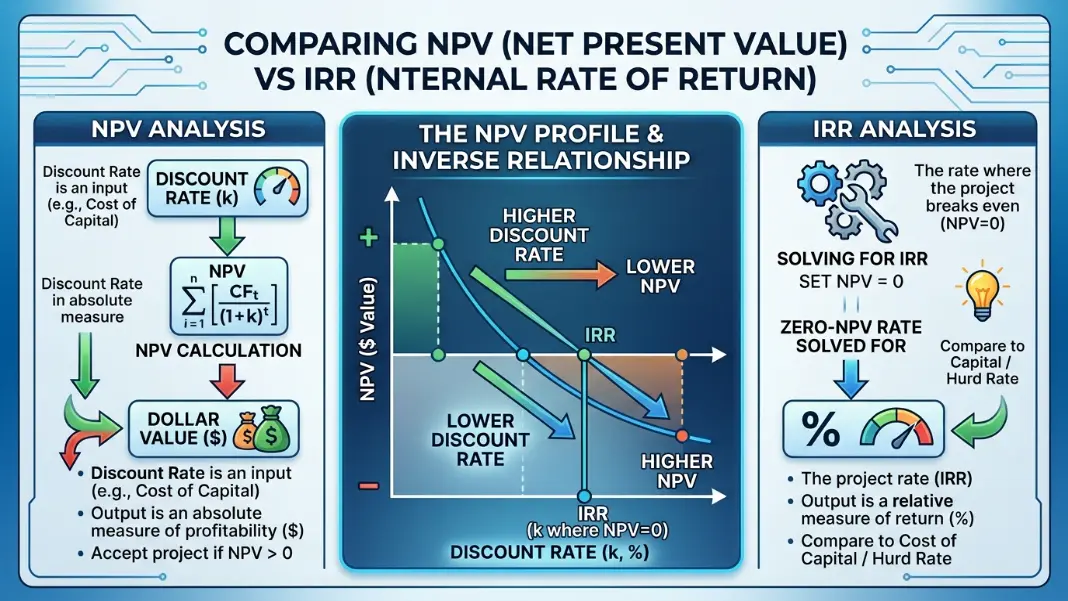
NPV takes a discount rate you specify (your cost of capital or required return) and calculates the dollar value of the investment at that rate.
NPV = CF0 + CF1/(1+r)^1 + CF2/(1+r)^2 + ... + CFn/(1+r)^n

Where r = your specified discount rate
Output: a dollar amount (positive = value created, negative = value destroyed)
IRR flips the problem. Instead of taking a discount rate and finding a value, it finds the discount rate that makes NPV exactly equal to zero.
IRR: find r such that NPV = 0

Output: a percentage (the embedded return rate)
NPV requires you to decide your discount rate before running the calculation. IRR does not. IRR tells you what rate the investment actually delivers, and you compare it to your hurdle rate afterward. For the formula derivation and how iteration works, the IRR Formula Guide covers the Newton-Raphson method in detail.
A positive NPV at your discount rate and an IRR above that same discount rate are the same conclusion expressed differently. Positive NPV at 10% means IRR is above 10%. IRR above 10% means NPV at 10% is positive. For a single project evaluated against a single hurdle rate, they always agree on accept or reject.
When IRR and NPV Give the Same Verdict
For a single, independent project with conventional cash flows (one initial outflow followed by only positive inflows), IRR and NPV will never conflict. They always agree on whether to invest.
The reason is mathematical. IRR is the rate where NPV crosses zero. If IRR = 15% and your hurdle rate is 10%, NPV at 10% is positive. If IRR = 8% and your hurdle rate is 10%, NPV at 10% is negative. The sign of NPV and the position of IRR relative to the hurdle rate point in the same direction for any conventional cash flow series.
This is why many practitioners default to IRR for standard deals. Saying "this investment returns 14%, which beats our 10% hurdle" is easier to communicate than "this investment has a positive NPV of $83,000 at our 10% cost of capital." Both statements describe the same investment outcome in different formats.
The Cap Rate Calculator handles the income yield side of real estate analysis. Combining a cap rate analysis at entry with an IRR and NPV model over the hold period gives a more complete picture than either metric alone.
Four Scenarios Where IRR and NPV Give Different Answers
When any of these four conditions exist, IRR and NPV can rank investments differently or give conflicting guidance.
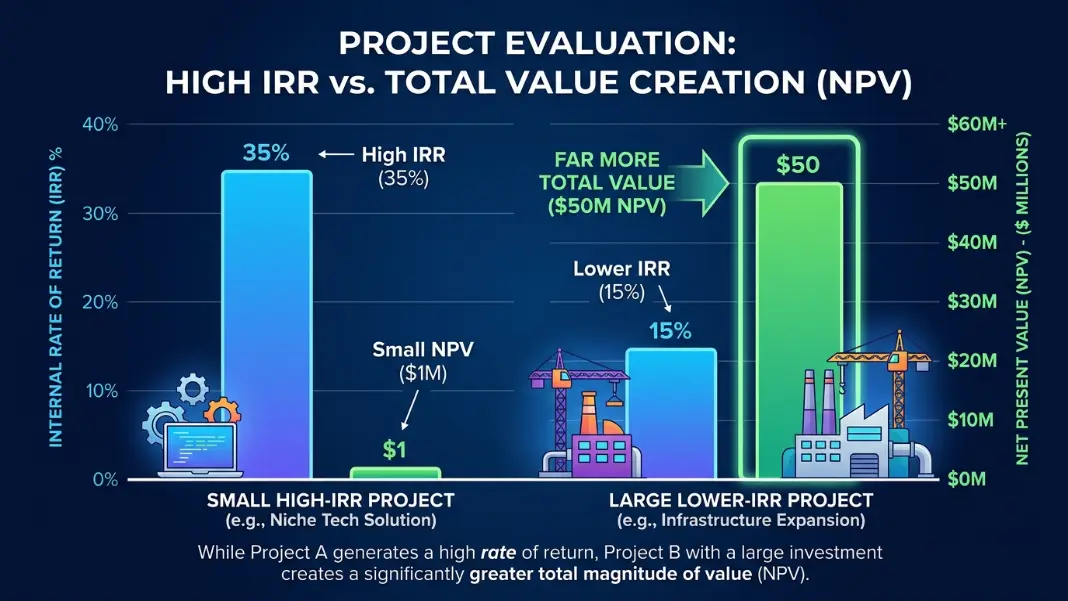
1. Different investment scales
IRR is a percentage and ignores total capital deployed. NPV is a dollar amount and reflects total value created. When comparing a small investment at a high IRR against a large investment at a lower IRR, the two metrics point in opposite directions.
| Investment | Capital | IRR | NPV at 10% |
|---|---|---|---|
| Project A | $50,000 | 25% | +$12,500 |
| Project B | $500,000 | 14% | +$68,000 |
IRR ranks Project A higher. NPV ranks Project B higher. If you have $500,000 to deploy and must choose, NPV is telling you the more useful thing: Project B creates over 5x more wealth.
2. Mutually exclusive projects
When you can only choose one of two investments (same site, same team, same budget), IRR can misrank them even at the same scale. This happens when cash flow timing differs significantly: one project front-loads returns, the other back-loads them. IRR favors earlier returns due to the compounding math; NPV captures total value at the cost of capital regardless of timing.
3. Non-conventional cash flows (multiple sign changes)
When cash flows alternate between positive and negative more than once (a large renovation cost or remediation expense that comes after years of positive income), the IRR equation can have multiple mathematically valid solutions. IRR becomes unreliable in this scenario. NPV with a stated discount rate always produces a single, reliable answer.
4. Different reinvestment rate assumptions
Standard IRR assumes all interim cash flows are reinvested at the IRR rate itself. A deal with a 20% IRR assumes every distribution can find a new 20% investment opportunity. NPV assumes reinvestment at the discount rate you specify, which is more realistic for most investors. When reinvestment opportunities are limited, IRR overstates the achievable return compared to NPV.
The Scale Problem: Why IRR Misranks Investments of Different Sizes
Scale is the most common scenario where practitioners use IRR and end up making the wrong capital allocation decision. It deserves more attention than it typically gets.
The issue: IRR measures the return rate, not the wealth created. The same $100 invested at 30% IRR creates $30 in a year. $10,000 invested at 12% creates $1,200. IRR ranks the first investment higher. Your net worth disagrees.
Wealth created depends on both rate and capital:

$100 at 30% for 1 year = $30 profit
$10,000 at 12% for 1 year = $1,200 profit

IRR ranking: first investment wins
Wealth creation: second investment wins by 40x
The practical version comes up when comparing two real estate deals. A $500,000 value-add deal at 18% IRR and a $5,000,000 core deal at 11% IRR look very different on paper. But the core deal, if you have the capital, may create dramatically more total wealth.
At 18% IRR, a $500,000 investment over 5 years produces roughly $1,130,000 in total returns. At 11% IRR, a $5,000,000 investment over 5 years produces roughly $8,400,000. The IRR on the smaller deal is 64% higher. The wealth created is 7.4x lower.
The fix is always to calculate NPV alongside IRR when investment sizes differ. NPV at your cost of capital tells you the absolute dollar value created, which is the metric that matters for capital allocation decisions.
Which Metric to Trust When You Have to Pick One
Most experienced practitioners use both metrics and report both. When you must rely on one, the guidance is straightforward.
Use IRR when: you are communicating returns to investors or partners (percentages are more intuitive), comparing investments of similar size and holding period, evaluating a single project against a known hurdle rate, or benchmarking performance against funds or deals in the same market.
Use NPV when: you are comparing investments of different sizes, choosing between mutually exclusive projects, cash flows change sign more than once, or making a capital allocation decision where total wealth creation matters more than annualized percentage.
For real estate and private equity analysis at the professional level, the industry reports both. IRR appears in fund presentations and investor communications. NPV appears in underwriting models as a cross-check. Neither alone gives the full picture.
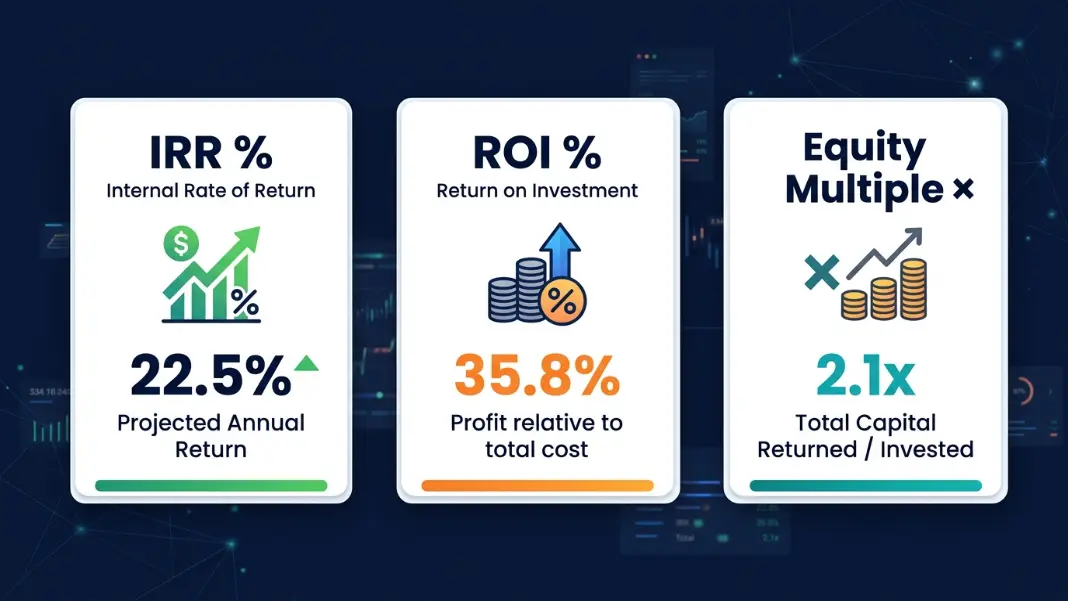
If you only have the IRR, check the equity multiple as a quick sanity test on wealth creation. Equity multiple = total cash received divided by capital invested. A 2.5x equity multiple over 5 years paired with a 15% IRR is internally consistent and suggests real wealth creation at scale. A 1.3x equity multiple with a 20% IRR suggests a short hold and limited absolute profit, which changes how useful that 20% figure actually is.
The IRR vs ROI and Equity Multiple Guide covers how IRR, ROI, and equity multiple fit together for a complete investment assessment, including when to use each and what each one misses.
IRR finds the discount rate that makes NPV equal to zero, expressed as a percentage. NPV calculates the dollar value of an investment at a discount rate you specify. IRR requires no assumed rate as input but produces a percentage. NPV requires your cost of capital as input but produces a dollar amount showing how much value is created. For a single project, they always agree on accept or reject. For comparing investments of different sizes, NPV is the more reliable metric.
Use IRR when communicating returns to investors, when comparing investments of similar size and holding period, or when evaluating a single project against a known hurdle rate. IRR is the standard metric in private equity fund reporting and most real estate investor presentations because the percentage format benchmarks directly against a hurdle rate. It works best when projects are independent and similarly scaled. For capital allocation decisions involving unequal investment sizes, NPV is more reliable.
Yes. When comparing investments of different sizes, IRR can rank a small high-percentage investment above a large lower-percentage one, while NPV ranks the large investment higher because it creates more total wealth. Mutually exclusive projects with different cash flow timing also produce conflicting rankings. In both cases, NPV is the more reliable basis for the final decision because it reflects total value created in dollar terms, not just the annualized percentage return rate.
For communicating and benchmarking, IRR is more useful because it compares directly to a hurdle rate or market benchmark. For capital allocation, especially when comparing deals of different sizes, NPV is more reliable. Most experienced real estate investors use both: IRR to communicate and benchmark, NPV to confirm a deal creates meaningful value in absolute dollar terms. The equity multiple serves as a third cross-check on total return relative to capital invested.
When cash flows change sign more than once, the IRR equation can have multiple mathematically valid solutions. A standard IRR calculator returns one number, but which root it finds depends on the starting guess, and neither result may reflect the economically meaningful return. In this situation, use NPV with a stated discount rate, which always produces a single reliable answer. Modified IRR (MIRR) is also appropriate and produces a unique result for any cash flow pattern.
No, for conventional cash flows. If IRR exceeds your discount rate, NPV is positive at that rate. If IRR falls below your discount rate, NPV is negative. The two metrics are mathematically linked through the discount rate, and their conclusions on accept-or-reject must agree for any cash flow series where the sign changes only once. This relationship breaks down when cash flows change sign multiple times, which can produce technically valid but misleading IRR values alongside NPV figures.
Written by
Hassaan Rasheed
Web Developer & Content Researcher
Hassaan builds calculators and writes research-backed guides on finance, math, payroll, and construction topics. Every number in his articles is sourced from official data and worked through by hand.
View LinkedIn Profile