Hurdle Rate vs IRR: How Return Thresholds Work in Investment Decisions (2026)
Hurdle rate vs IRR: how return thresholds are set, the accept/reject decision rule, and where IRR above the hurdle rate can still mislead.
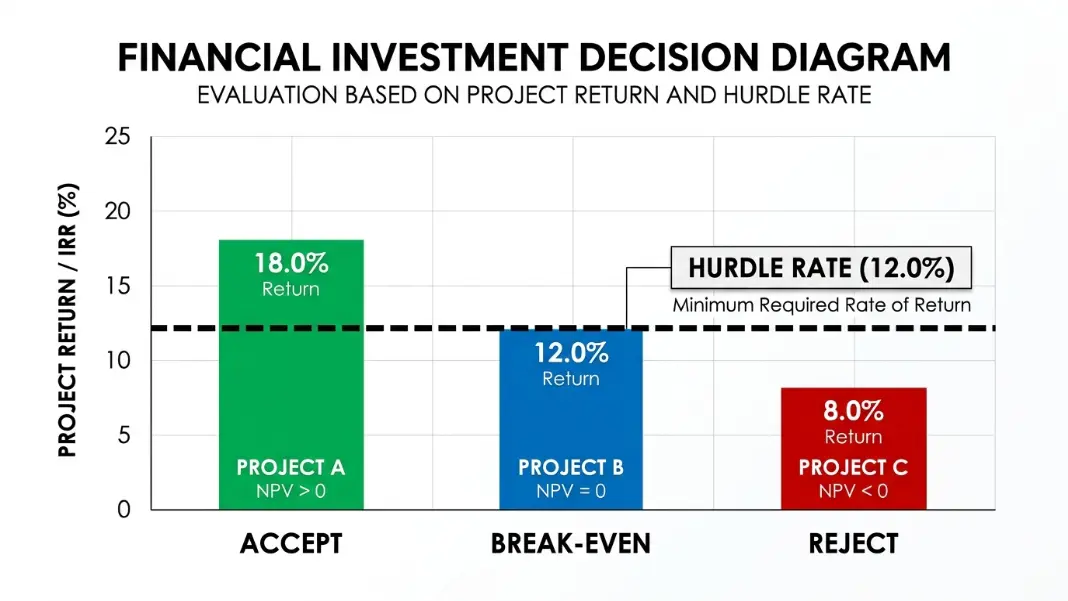
Seeing an IRR of 18% feels like a win. Whether it is one depends on what that 18% is being compared against. Hurdle rate vs IRR is the comparison that determines whether an investment is worth pursuing: the IRR is what the investment delivers; the hurdle rate is the minimum it needs to deliver. An 18% IRR on a core-plus real estate deal is exceptional. The same 18% on a venture capital investment is below the minimum most LPs would accept.
Without the hurdle rate, the IRR is just a number. The IRR Calculator computes the projected return for any cash flow series so you can run the comparison directly. This guide covers what the hurdle rate is and how it differs from IRR, how the accept/reject decision rule works in practice, how hurdle rates are actually set, what the standard looks like in private equity and real estate, and where the comparison breaks down.
What a Hurdle Rate Is and How It Differs From IRR#
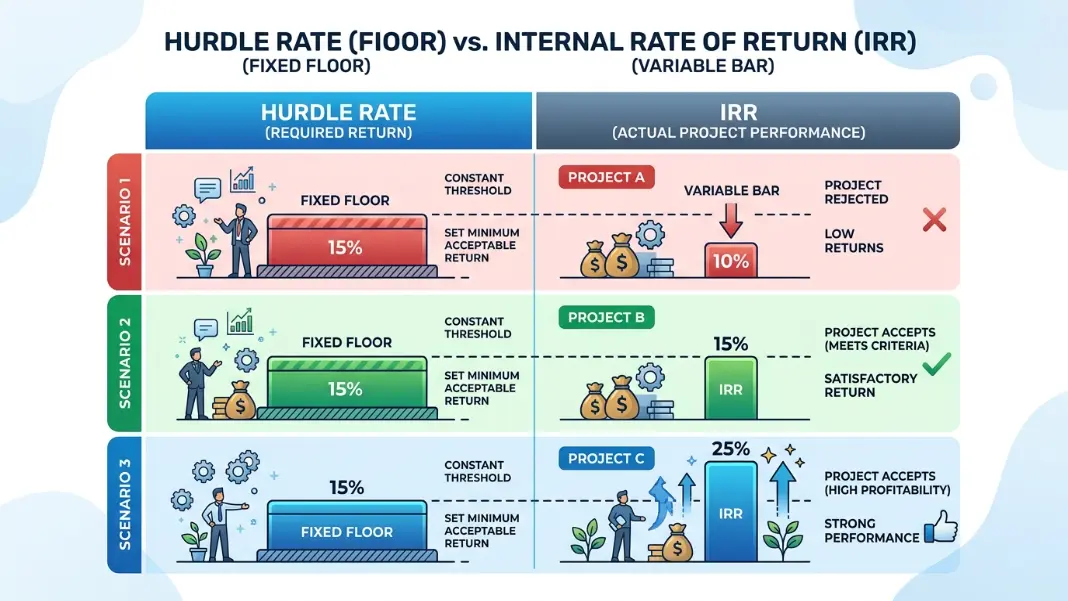
A hurdle rate is a threshold, not a calculation. It is set in advance, before any individual investment is analyzed, and represents the lowest return a firm or investor will accept given the risk, cost of capital, and opportunity cost of the capital being deployed.
The IRR, by contrast, is a property of a specific investment. It is the discount rate that makes the net present value of a cash flow series equal to zero. The hurdle rate is what you need; the IRR is what the investment delivers.
The comparison between the two drives the decision:
| Comparison | Decision |
|---|---|
| IRR > Hurdle Rate | Accept: the investment exceeds the return threshold |
| IRR = Hurdle Rate | Break even: the investment exactly meets the minimum |
| IRR < Hurdle Rate | Reject: the investment fails to meet the minimum |
These categories assume the hurdle rate is calibrated correctly for the investment's risk. A hurdle rate set too low accepts bad investments; one set too high rejects good ones.
The hurdle rate carries several other names depending on context. In corporate finance it is often called the minimum acceptable rate of return (MARR) or required rate of return. In private equity and real estate fund structures it is the preferred return or pref. In discounted cash flow analysis it is the discount rate. These are the same concept applied in different settings.
What the hurdle rate is not:
The hurdle rate is not the expected return. It is the floor below which the investment is not worth the risk compared to alternatives. A deal that clears the hurdle at 11.2% when the hurdle is 10% is acceptable; whether it is a good use of capital depends on what else is available and whether the margin of 120 basis points is enough buffer against projection error.
Hurdle rates also differ from benchmarks. A benchmark compares realized performance against a market index after the fact. The hurdle rate filters investments before capital is committed.
How the Hurdle Rate Decision Rule Works#
The mechanics are straightforward: calculate the IRR of the proposed investment, compare it to the hurdle rate, accept if it clears, reject if it does not. The useful part is understanding what the margin above the hurdle actually represents.
Worked example:
A commercial real estate acquisition requires $750,000 in equity. Projected cash flows over a 7-year hold:
- Years 1 to 6: $65,000 per year in net operating cash flow after debt service
- Year 7: $65,000 operating cash flow plus $920,000 in net sale proceeds = $985,000
This series produces an IRR of approximately 13.4%.
If the firm's hurdle rate for value-add commercial properties is 12%, the decision follows: 13.4% clears 12% by 140 basis points. The investment meets the threshold.
If projected sale proceeds fall to $780,000 due to a higher exit cap rate, the year 7 terminal cash flow becomes $845,000 and the IRR drops to approximately 10.8%. That fails the 12% hurdle. The same asset, at the same entry price and operating performance, becomes a pass because the exit scenario no longer clears the threshold.
What the margin above the hurdle tells you:
The spread between IRR and hurdle rate is the margin of safety against projection error. A 13.4% IRR against a 12% hurdle holds only 140 basis points of cushion. If occupancy runs 5% below projection or the exit cap rate widens by 50 basis points, that margin is gone. A 16% IRR against the same 12% hurdle has 400 basis points of cushion before the deal fails its own threshold.
For context on what makes an IRR strong or weak for a specific strategy, the What Is a Good IRR guide covers benchmarks from core real estate through venture capital.
What the break-even means:
When IRR exactly equals the hurdle rate, the investment earns precisely its cost of capital and no more. Shareholders are compensated for risk but no value is added beyond covering that cost. In corporate capital budgeting, projects at the break-even are typically rejected because the margin against projection error is zero and the capital could sit in the next deal above the hurdle.
How Hurdle Rates Are Set: WACC, Risk Premiums, and Policy Floors#
The hurdle rate is derived from the investor's cost of capital, adjusted upward for risk. Three inputs shape most hurdle rate calculations.
WACC as the starting point:
For corporate investment decisions, the hurdle rate starts with the weighted average cost of capital. WACC blends the after-tax cost of debt with the cost of equity, weighted by the capital structure.
WACC = (Equity / Total Capital) × Cost of Equity
     + (Debt / Total Capital) × Cost of Debt × (1 - Tax Rate)
A firm with 60% equity at a 12% required return and 40% debt at 6% pre-tax with a 30% tax rate:
WACC = 0.60 × 12% + 0.40 × 6% × (1 - 0.30)
     = 7.2% + 1.68%
     = 8.88%
An investment must return at least 8.88% just to cover the blended cost of capital. Any project below that destroys value even if it is nominally profitable.
Risk premium above WACC:
Most firms add a project-specific risk premium on top of the base WACC. A new product line in an unfamiliar market carries more execution risk than a capacity expansion in an existing facility. The higher risk demands a higher return threshold.
Hurdle Rate = WACC + Project Risk Premium
Risk premiums of 2 to 5 percentage points above WACC are common in corporate practice. A firm with an 8% WACC might apply a 12% hurdle to speculative projects and a 10% hurdle to low-risk expansions.
Policy floors:
Many private equity and real estate funds set the hurdle as a fund-level policy, independent of WACC. An 8% preferred return is standard in US buyout and real estate fund structures. This is the minimum annual return LPs must receive before the GP earns carried interest. The policy floor reflects LP expectations and capital cost assumptions baked in at fund formation, not deal-by-deal WACC calculations.
The relationship between IRR and NPV in these frameworks is covered in the IRR vs NPV guide, which explains when NPV comparison at the hurdle rate produces better capital allocation decisions than IRR comparison alone.
Hurdle Rates in Private Equity and Real Estate#
These two asset classes have the most explicit and standardized hurdle rate structures of any investment category.
Private equity: the 8% preferred return
The most widely used hurdle rate in private equity is 8% per year on invested capital, compounded annually. This is called the preferred return or pref. The economic structure works as follows:
- The fund returns invested LP capital
- The fund distributes returns up to 8% annually to LPs (clearing the hurdle)
- Above the 8% hurdle, the GP earns carried interest, typically 20% of profits
- Some structures include a GP catch-up provision so the GP earns a larger share until their carry is proportional
A fund returning 11% net to LPs clears the 8% hurdle by 300 basis points, and the GP participates in that outperformance through carry. A fund returning 6.5% net never triggers the carry structure. The LP receives all returns, but the GP earns nothing above management fees.
Venture capital typically applies higher hurdles, often 12 to 15%, reflecting longer holding periods and higher binary risk. Distressed debt and special situations funds commonly target 15 to 18% gross IRR as the investment-level threshold.
Real estate: hurdle rates by strategy
Real estate hurdle rates follow the risk profile of the strategy:
| Strategy | Typical IRR Hurdle | Risk Profile |
|---|---|---|
| Core | 5 to 7% | Stabilized assets, major markets |
| Core-plus | 8 to 10% | Some value creation, lower-tier markets |
| Value-add | 12 to 16% | Significant repositioning required |
| Opportunistic | 18%+ | Development, distressed, high execution risk |
An 11% projected IRR on a value-add deal fails the hurdle for that strategy even though 11% is a strong absolute return. The strategy classification determines which hurdle applies. Applying the wrong hurdle to the deal type produces bad capital allocation decisions regardless of how well the individual IRR calculation is done.
The Real Estate IRR guide covers how these return benchmarks apply in practice, including how debt financing affects the gap between levered and unlevered IRR.
When IRR Clears the Hurdle Rate But the Investment Is Still Wrong#
Passing the hurdle rate is a necessary condition for accepting an investment, not a sufficient one. Three situations produce a misleading hurdle rate vs IRR comparison.
The reinvestment rate assumption:
IRR assumes that all interim cash flows are reinvested at the IRR itself for the remaining holding period. On a deal projecting 22% IRR, the calculation implicitly assumes every cash distribution is immediately redeployed at 22%. That is rarely achievable. If interim cash flows are reinvested at a lower rate closer to the actual cost of capital, the realized compound return falls below the projected IRR.
The Modified IRR (MIRR) corrects this by applying a specified reinvestment rate to interim distributions. When reinvestment at the full IRR is not realistic, comparing MIRR to the hurdle rate produces a more honest picture of whether the investment clears the bar.
The scale problem:
A 28% IRR on a $200,000 investment that clears a 15% hurdle creates $26,000 of excess return in year one. A 17% IRR on a $5,000,000 investment clearing the same 15% hurdle creates $100,000 of excess return. The higher-IRR deal is the worse capital allocation choice when the firm can only do one and both clear the hurdle.
When capital is constrained and multiple investments all pass the hurdle rate, IRR ranking does not identify the best use of capital. Net present value comparison at the hurdle rate does, because NPV captures both the rate of return and the capital base it operates on.
Multiple IRR values:
A cash flow series that changes sign more than once (negative, then positive, then negative again) can produce more than one valid IRR. Both solutions technically satisfy the IRR equation, and one or both may clear the hurdle rate. Confirming which root reflects the economics of the actual investment period requires analyzing the direction and timing of cash flows, not just accepting the first solution the calculator returns.
Any cash flow series with a significant midstream outflow (a capital call, renovation reserve, or lease commission during a hold) should be checked for sign changes before the hurdle rate comparison is treated as conclusive.
The hurdle rate is a minimum return threshold set before analyzing any specific investment; the IRR is the projected return calculated from the investment's actual cash flows. The hurdle rate represents what an investor requires; the IRR represents what the investment delivers. If IRR exceeds the hurdle rate, the investment meets the minimum threshold and is accepted. If IRR falls below it, the investment is rejected. The hurdle rate is a policy decision; IRR is a mathematical output from projected cash flows.
When IRR exceeds the hurdle rate, the investment clears the return threshold and meets the minimum criterion for acceptance. The margin above the hurdle represents excess return above the minimum required. A 14% IRR against a 10% hurdle generates 400 basis points of buffer against projection error before the deal falls below the threshold. A larger margin generally means the investment is more insulated from underperformance in operating assumptions or exit scenarios.
The standard hurdle rate in US private equity is 8% per year compounded annually, known as the preferred return. This is the minimum annual return limited partners must receive before the general partner earns carried interest. Venture capital funds typically apply higher hurdles of 12 to 15% given longer investment timelines and higher binary risk. Distressed debt and special situations funds commonly use 15 to 18% gross IRR as the investment-level threshold for individual positions.
Real estate hurdle rates follow the strategy's risk profile: core properties target 5 to 7%, core-plus 8 to 10%, value-add 12 to 16%, and opportunistic deals 18% or higher. These ranges reflect the execution risk, market risk, and capital improvement requirements of each strategy. A 13% projected IRR on a core asset is exceptional; the same 13% on a value-add deal is borderline. The strategy classification determines which hurdle applies, not the IRR in isolation.
Most firms start with WACC as the base rate, then add a risk premium for the specific investment type. A firm with an 8% WACC might apply a 12% hurdle to speculative projects and a 10% hurdle to lower-risk expansions. Private equity and real estate funds typically set a fund-level hurdle at formation based on LP expectations, with 8% being the standard in US buyout and real estate structures. The hurdle should reflect the actual cost of capital plus the minimum compensation for the risk being taken.
Yes. When multiple projects all clear the hurdle rate but capital is limited, IRR alone does not rank them correctly. A 30% IRR on a small investment may create less total value than a 14% IRR on a large one when the hurdle is 10% on both. Net present value comparison at the hurdle rate identifies the best use of limited capital because NPV captures both the rate of return and the scale of the capital base earning that return.
Written by
Hassaan Rasheed
Web Developer & Content Researcher
Hassaan builds calculators and writes source-linked guides across the site's subject areas. Calculator methods and reference data are documented in each guide so readers can verify the underlying sources.
About the author and methods