Waist to Hip Ratio Chart: WHO Risk Thresholds for Women and Men (2026)
Waist to hip ratio chart with WHO thresholds: below 0.85 for women and 0.90 for men avoids the abdominal obesity cutoff. How to measure and what your ratio means.
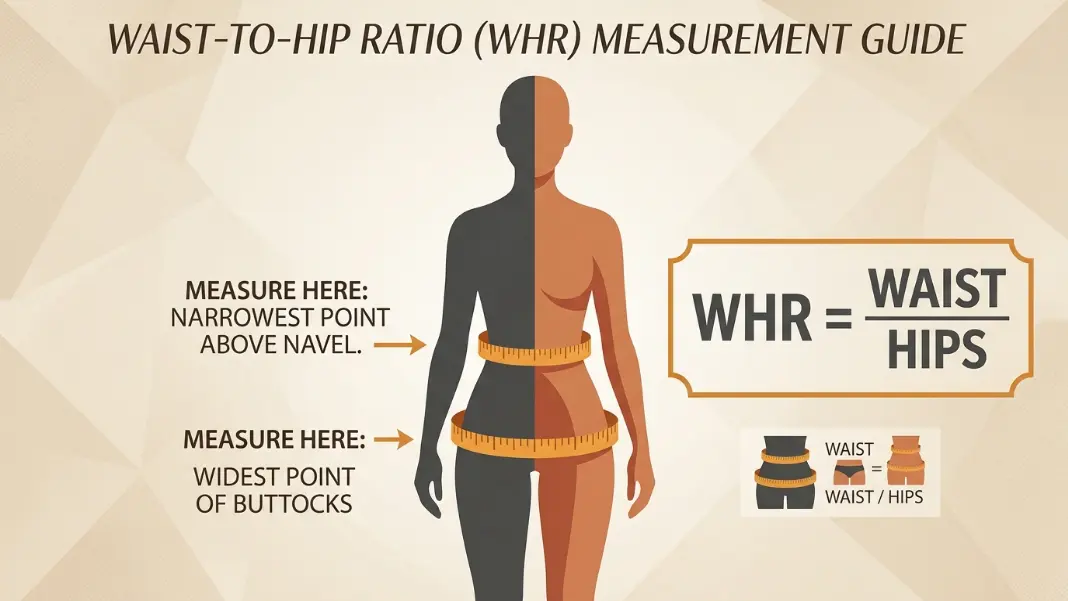
The waist to hip ratio (WHR) divides your waist circumference by your hip circumference. A woman with a 30-inch waist and 38-inch hips has a WHR of 0.79. A man with a 40-inch waist and 42-inch hips has a 0.95. Those two numbers land in different risk categories, and the difference matters: the World Health Organization classifies a WHR at or above 0.85 in women and at or above 0.90 in men as abdominal obesity, a condition linked to increased risk of heart disease, type 2 diabetes, and metabolic syndrome.
The Waist to Hip Ratio Calculator takes your two measurements and returns your ratio alongside its WHO risk category. This guide covers what that number means, how to measure so the result is accurate, how WHR compares to BMI and body fat percentage, and what actually drives where fat accumulates in your body.
The Formula#
WHR = Waist circumference ÷ Hip circumference
Both measurements must use the same unit. Inches and centimeters both work; mixing them does not.
Worked example: woman, low risk
Waist:  29 inches
Hip:    37 inches
WHR = 29 ÷ 37 = 0.78
A WHR of 0.78 for a woman falls below the 0.80 low-risk threshold.
Worked example: man, high risk
Waist:  40 inches
Hip:    42 inches
WHR = 40 ÷ 42 = 0.95
A WHR of 0.95 for a man exceeds the WHO 0.90 abdominal obesity threshold.
The formula produces a unitless number between roughly 0.65 and 1.10 for most adults. Ratios above 1.0 are possible when waist circumference exceeds hip circumference, which occurs in men with significant central obesity. The ratio does not change with measurement unit: 74 cm ÷ 94 cm and 29 in ÷ 37 in produce the same result.
WHO Waist to Hip Ratio Chart#
The thresholds below come from the World Health Organization's 2008 consultation on waist circumference and waist-hip ratio as markers of cardiovascular risk. They are the most widely cited reference in clinical research and public health screening.
| Risk Level | Women (WHR) | Men (WHR) |
|---|---|---|
| Low | Below 0.80 | Below 0.90 |
| Moderate | 0.80 to 0.84 | 0.90 to 0.94 |
| High (abdominal obesity) | 0.85 or above | 0.95 or above |
| WHO abdominal obesity cutoff | 0.85 | 0.90 |
Some clinical guidelines differ slightly. The American Heart Association uses 0.85 for women (matching WHO) but sets the male high-risk cutoff at 1.0 rather than 0.90. The discrepancy reflects different reference populations and study designs. The WHO thresholds are the more conservative standard and are the ones most referenced in cardiovascular disease research.
These thresholds are population-level screening tools, not individual diagnoses. A WHR of 0.86 in a woman does not mean she will develop heart disease. It means she belongs to a group with statistically higher incidence compared to those below 0.85. The number is a risk signal, not a sentence.
How to Measure Correctly#
An inaccurate measurement produces an inaccurate ratio. Most errors come from measuring at the wrong anatomical landmark or at the wrong time of day.
Waist measurement:
- Measure at the natural waist: the narrowest point between the bottom of the lowest rib and the top of the hip bone, roughly 1 inch above the navel for most people
- Stand upright with feet together
- Exhale normally and measure at the end of the exhale
- Do not hold your breath in or push your stomach out
- The tape should be horizontal, parallel to the floor, and snug without compressing the skin
Hip measurement:
- Measure at the widest point of the hips and buttocks
- This is usually 7 to 9 inches below the natural waist
- Stand with feet together and keep the tape horizontal and snug
Timing:
- Measure in the morning before eating, when the abdomen is least distended from digestion
- Wear thin clothing or measure directly against skin for consistency
The most common measurement error is placing the tape at the navel rather than the true narrowest point. For many people these are close together, but for others the navel sits lower and wider. Measuring too low inflates the waist number and raises the calculated ratio above its true value. If your waist and hip measurements are within 2 inches of each other, double-check that you measured the correct landmarks.
WHR vs BMI: What Weight Alone Cannot See#
BMI (body mass index) calculates weight divided by height squared. It tells you how heavy you are relative to your height but says nothing about where that weight is located. Two people with the same BMI can have very different waist-to-hip ratios because fat distribution varies substantially between individuals.
A person with a BMI of 23 (normal range) can carry most of their fat viscerally around the abdomen, producing a WHR above 0.85. Researchers have a name for this pattern: TOFI, or Thin Outside Fat Inside. TOFI individuals often appear lean but carry the metabolic risk factors that a normal BMI misses entirely.
The INTERHEART study analyzed over 27,000 participants across 52 countries and found that WHR was more strongly associated with myocardial infarction than BMI. Participants in the highest WHR quintile had 2.52 times the odds of a heart attack compared to those in the lowest quintile, after adjusting for other risk factors. BMI showed a weaker and less consistent association across the same population.
This does not make BMI useless. It is a fast, low-cost screening tool that correlates well with all-cause mortality at the population level. For individual assessment, combining BMI with WHR gives a more complete picture than either measurement alone. If you want to separate lean mass from fat mass more precisely, the FFMI Calculator estimates fat-free mass index from weight, height, and body fat percentage, which distinguishes muscle from fat in a way neither BMI nor WHR can do.
Body Shape, Fat Type, and What WHR Actually Reflects#
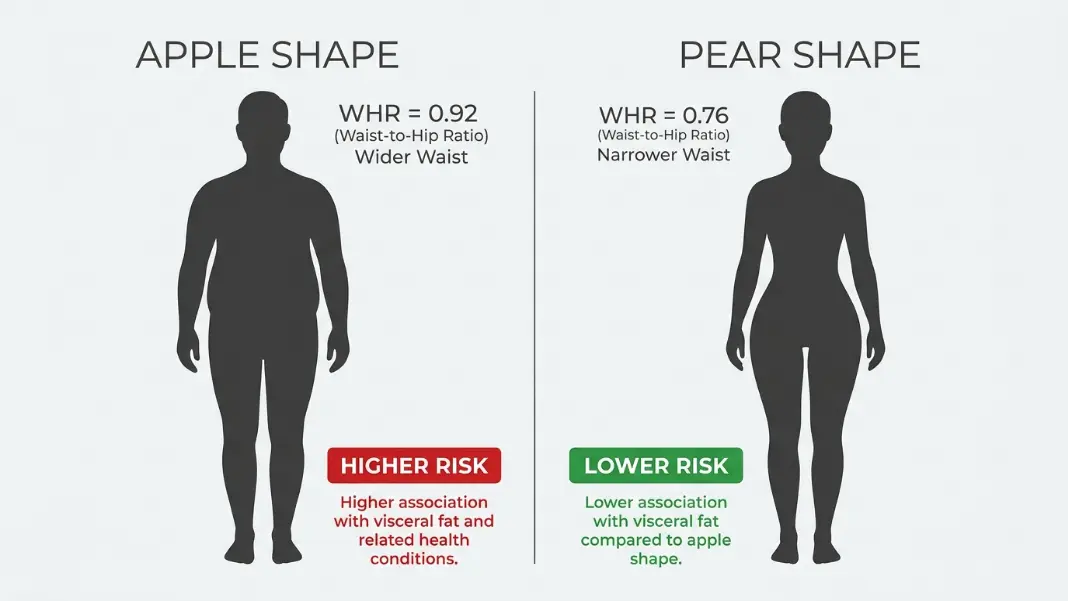
WHR is a proxy for the type of fat most associated with metabolic disease. There are two distinct fat compartments that matter here.
Subcutaneous fat sits directly under the skin. It concentrates in the hips, thighs, and buttocks. Metabolically it is relatively inert and is not strongly associated with cardiovascular risk on its own. People who carry more subcutaneous fat relative to visceral fat tend to have lower WHR and a pear-shaped body profile.
Visceral fat surrounds the internal organs inside the abdominal cavity. It is metabolically active: it releases fatty acids and inflammatory compounds directly into the portal circulation, which flows to the liver. High visceral fat is associated with insulin resistance, elevated triglycerides, low HDL cholesterol, high blood pressure, and chronic low-grade inflammation. It is the fat that matters most for metabolic disease risk.
WHR does not measure visceral fat directly (only imaging such as DEXA or MRI can do that), but waist circumference is a reliable proxy for visceral fat accumulation in most populations. A high waist measurement relative to the hips indicates the abdominal region carries a disproportionate share of body fat, which correlates with higher visceral fat. For an explanation of what different body composition measurement methods can and cannot capture, the InBody vs DEXA guide covers how scan-based measurements assess fat distribution and where each method falls short.
Hormones and fat redistribution:
Before menopause, estrogen promotes fat storage in the hips and thighs. After menopause, falling estrogen shifts fat distribution toward the abdomen. This is why WHR increases with age in women even without any change in total body weight. A woman with a WHR of 0.78 at age 35 may see it reach 0.83 or higher by age 55 through hormonal changes alone, independent of diet or exercise changes.
Ethnic variation in thresholds:
Research from South Asian, East Asian, and some Hispanic populations consistently shows that the universal WHO thresholds underestimate cardiovascular risk in these groups. South Asian men show elevated metabolic risk factors at WHR values well below 0.90. If you are South Asian, treat the WHO thresholds as a floor, not the full picture. Any reading in the moderate range warrants attention regardless of whether it clears the high-risk cutoff.
What You Can and Cannot Change#
Fixed factors:
Genetics determines a substantial part of where your body stores fat. Identical twins raised apart tend to store fat in similar distributions, which points to a strong hereditary component. Sex and hormonal biology also shape your baseline: women carry more subcutaneous hip fat by design. Age raises WHR in both sexes as visceral fat accumulates naturally over time.
Modifiable factors:
Aerobic exercise consistently reduces visceral fat independent of total weight change. Multiple controlled trials show that 150 to 200 minutes per week of moderate-intensity cardio reduces waist circumference measurably over 12 to 16 weeks, even when total body weight stays flat. This is because aerobic activity preferentially depletes visceral fat.
Caloric deficit reduces total body fat and typically lowers waist circumference. Resistance training preserves lean mass in the hips and thighs during a deficit, which helps maintain hip circumference as waist shrinks and improves the ratio more than cardio alone.
Sleep matters more than most people expect. Chronic sleep below 6 hours per night elevates cortisol, which specifically promotes visceral fat accumulation. Studies tracking WHR over multi-year periods consistently find worse ratios in short sleepers, controlling for diet and physical activity.
One thing that does not work: spot reduction. Abdominal exercises build the muscle underneath the fat but do not preferentially burn fat from that area. Waist circumference responds to systemic caloric deficit and cardiovascular training, not crunches or planks.
For tracking body composition changes over time, the FFMI Calculator pairs well with WHR monitoring. A declining WHR alongside stable or increasing FFMI means you are losing fat and maintaining muscle, which is the better outcome compared to weight loss alone. The FFMI body composition guide covers how to interpret FFMI alongside body fat measures for a fuller picture of training progress.
A healthy waist to hip ratio for women is below 0.85 according to the WHO. Ratios below 0.80 are low risk. The range from 0.80 to 0.84 is moderate risk, meaning elevated cardiovascular risk relative to the low-risk group but below the clinical threshold for abdominal obesity. A ratio of 0.85 or above places a woman in the high-risk category for heart disease, type 2 diabetes, and metabolic syndrome based on the WHO 2008 consultation criteria.
For men, the WHO threshold for abdominal obesity is a WHR of 0.90 or above. Ratios below 0.90 fall within the normal range, with ratios below 0.85 indicating low risk. Men naturally carry proportionally more abdominal fat and less hip fat than women, which is why their threshold is higher than the female cutoff. Some guidelines, including the American Heart Association, set the male high-risk threshold at 1.0, but the WHO's more conservative 0.90 cutoff is the standard used in most cardiovascular risk research.
For predicting cardiovascular disease risk specifically, WHR is more accurate than BMI in most research populations. The INTERHEART study found WHR more predictive of myocardial infarction than BMI across 52 countries and 27,000 participants. BMI cannot distinguish where body fat is located, so a normal-weight person with central obesity appears low-risk by BMI alone. That said, WHR requires accurate measurement technique and does not directly measure visceral fat. Using both metrics together provides a more complete picture than either measurement alone.
Measure your waist at the narrowest point between your lowest rib and the top of your hip bone, approximately 1 inch above the navel for most adults. Stand upright, exhale normally, and measure at the end of the exhale without holding your breath in. The tape should be horizontal and snug without compressing the skin. Measuring at the navel rather than the true narrowest point is the most common error and inflates the waist number, producing a higher ratio than your actual value.
Yes. Aerobic exercise and caloric deficit both reduce visceral fat, which lowers waist circumference and improves WHR over time. Research shows 150 to 200 minutes of moderate cardio per week reduces waist circumference measurably over 12 to 16 weeks independent of total weight change. Resistance training preserves hip and thigh muscle, maintaining hip circumference as waist shrinks and improving the ratio further. Spot reduction through abdominal exercises does not work. Waist circumference responds to systemic fat loss, not targeted training of the muscles underneath the fat.
Yes, WHR increases with age in both sexes. After menopause, falling estrogen levels shift female fat distribution from the hips and thighs toward the abdomen, raising WHR even without any change in total body weight. In men, visceral fat accumulates steadily from the 30s onward. A woman who measured 0.78 at age 35 may find her ratio at 0.83 or above by age 55 through hormonal changes alone. This is why age-specific context matters when comparing your number to population averages.
Written by
Hassaan Rasheed
Web Developer & Content Researcher
Hassaan builds calculators and writes source-linked guides across the site's subject areas. Calculator methods and reference data are documented in each guide so readers can verify the underlying sources.
About the author and methods