FFMI Calculator: What Your Score Means and the Natural Limit (2026)
FFMI calculator: fat-free mass index formula, score chart by training level, the natural limit of 25, and how FFMI compares to BMI for body composition.
BMI treats muscle and fat as the same thing. A 5'10" competitive powerlifter at 200 lbs registers as overweight. A competitive bodybuilder in contest condition reads the same as someone who has never trained. The scale cannot tell the difference because BMI does not look at what the weight is made of.
FFMI, or Fat-Free Mass Index, separates lean tissue from fat mass. It measures only the muscle and bone component of your weight relative to your height, which produces a number that means something specific about training status rather than just weight. The FFMI Calculator takes your height, weight, and body fat percentage and returns both the raw and normalized score with category interpretation. This guide explains the formula, what each score range actually represents, the natural ceiling that research has identified, and why FFMI outperforms BMI for anyone who lifts.
The FFMI Formula: Calculating Fat-Free Mass Index#
FFMI requires three inputs: height, total body weight, and body fat percentage.
Fat-Free Mass = Total Body Weight × (1 - Body Fat %)
FFMI = Fat-Free Mass (kg) / Height (m)²
Most reference data uses normalized FFMI, which adjusts the raw score to a standard height of 1.80 m. This makes comparisons between people of different heights meaningful rather than penalizing taller individuals for the way height is squared in the denominator.
Normalized FFMI = Raw FFMI + 6.1 × (1.80 - Height in meters)
Worked example:
- Height: 5'10" = 1.778 m
- Weight: 185 lbs = 83.9 kg
- Body fat: 15%
- Fat-free mass: 83.9 × (1 - 0.15) = 83.9 × 0.85 = 71.3 kg
- Raw FFMI: 71.3 / (1.778)² = 71.3 / 3.161 = 22.6
- Normalized FFMI: 22.6 + 6.1 × (1.80 - 1.778) = 22.6 + 0.13 = 22.7
The normalization step matters most at height extremes. A 6'4" person and a 5'8" person with identical lean mass will show different raw FFMI scores because taller people have a larger denominator. Normalized FFMI corrects this so the score reflects lean mass development rather than height.
Body fat percentage is the most important input to get right. FFMI is only as accurate as the body fat estimate you feed it.
- DEXA scan: 2 to 3% measurement error, gold standard for most people
- Hydrostatic weighing: comparable to DEXA
- Skinfold calipers (experienced technician): 3 to 4% error, acceptable
- BIA home scales: 4 to 8% error depending on hydration status, least reliable
A 5-percentage-point body fat error on a 185 lb frame shifts the lean mass estimate by about 9 lbs, which moves the FFMI by roughly 1.3 points. That is enough to change the interpretation category. If your body fat comes from a home scale after a large meal or during dehydration, the FFMI score you calculate is not reliable. The InBody Scan vs DEXA guide covers exactly why gym BIA machines and DEXA scans often produce readings 3 to 5 points apart, and which one to trust for a calculation like FFMI.
The Bench Press Max Calculator estimates your one-rep max from submaximal sets, which alongside FFMI gives a more complete picture of strength development than either metric provides on its own.
FFMI Score Chart: What Each Range Represents#
FFMI scores follow a natural distribution shaped by training history, genetics, and the physiological limits of lean mass accumulation without pharmacological intervention. The categories below are based on the Kouri et al. 1995 study and subsequent research on natural and assisted athletes.
The table applies to males. Female FFMI scores run approximately 3 to 4 points lower at equivalent training levels due to differences in muscle mass distribution and essential fat requirements.
| Normalized FFMI | Male Classification | What It Typically Reflects |
|---|---|---|
| Below 17 | Below average | Sedentary or very low muscle mass |
| 17 to 19 | Average | Untrained or minimal training history |
| 19 to 21 | Above average | 1 to 2 years of consistent resistance training |
| 21 to 22 | Athletic | 3 to 4 years of dedicated training |
| 22 to 23 | Competitive amateur | Multi-year dedicated training, good genetics |
| 23 to 25 | Advanced natural | Elite natural competitor territory |
| Above 25 | Rare naturally | Common with performance-enhancing drug use |
| Above 28 | Not achievable naturally | Only with significant pharmacological support |
For most recreational gym-goers, an FFMI between 19 and 22 represents a meaningful and achievable target with consistent training. Reaching 23 to 25 naturally requires years of optimized progressive overload and favorable genetics. The region above 25 is where the published research draws a significant line.
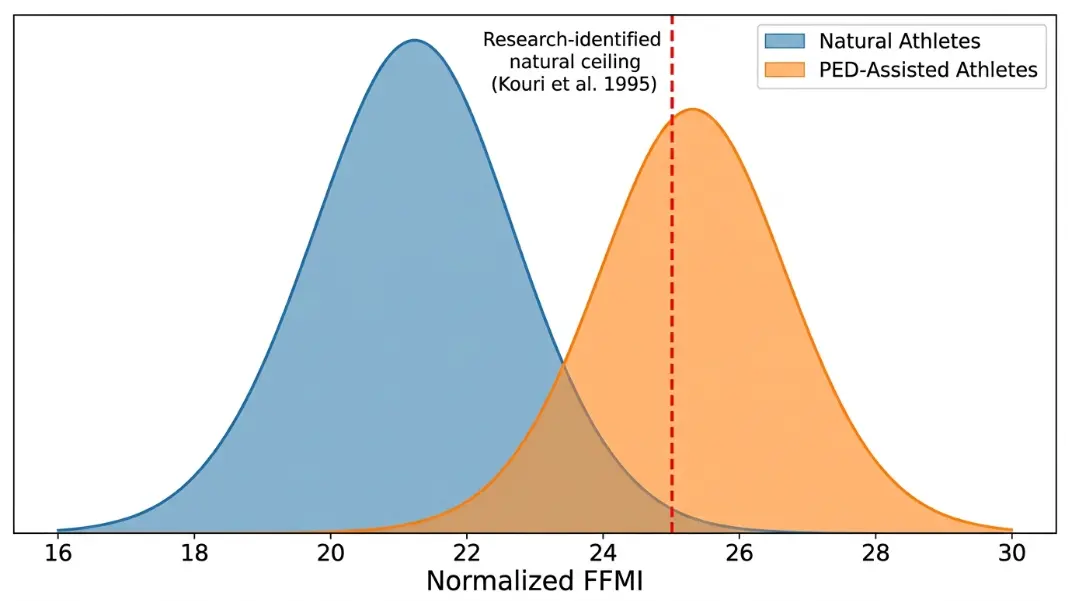
The Natural FFMI Ceiling: The Research Behind 25#
The 25 threshold entered scientific literature through a 1995 study by Kouri and colleagues published in Psychosomatic Medicine. The researchers measured 157 male athletes, including competitive natural bodybuilders, recreational lifters, and athletes with confirmed steroid use. Their finding: every athlete who exceeded a normalized FFMI of 25 was either a confirmed steroid user or had indeterminate status. No confirmed natural athlete in the study scored above 25.
The study had a relatively small sample. It has been extended, criticized, and debated in the years since. The practical consensus is that FFMI 25 functions as a soft ceiling for natural athletes, not an absolute wall. There are verified natural competitors who have reached 25 to 26. But they are genuine outliers, not a population.
The ceiling exists because of physiology, not motivation. Muscle protein synthesis rates, androgen receptor density, and the structural limits of tendon and bone attachment determine the maximum lean mass a body can accumulate and sustain without pharmaceutical augmentation of anabolic signaling. After 8 to 10 years of optimized training, most males approach their genetic ceiling somewhere in the 23 to 26 FFMI range.
Factors that influence where your ceiling sits:
Genetics and androgen receptor density. Myostatin gene variants and androgen receptor density affect how much lean mass you can accumulate. These are fixed. Two people following the same program for 10 years can reach meaningfully different FFMI ceilings for genetic reasons alone.
Training age and programming quality. The first two years of resistance training produce the fastest relative lean mass gains of any period. The rate decelerates progressively. After five years of serious training, annual lean mass gains are measured in 1 to 3 lbs, not 10 to 15 lbs. This is biology, not failure.
Sleep. The majority of muscle protein synthesis occurs during slow-wave sleep. Chronic sleep restriction below 7 hours measurably reduces lean mass accrual independent of training volume or protein intake. This is one of the most underweighted variables in practice.
Protein intake. The research consensus for individuals in a lean-gaining phase is 0.7 to 1.0 grams of protein per pound of body weight per day. Below that threshold, lean mass gains are suboptimal regardless of training quality or sleep consistency.
FFMI vs BMI: What the Simpler Metric Gets Wrong#
BMI was designed as a population-level screening tool for public health surveillance, not a body composition assessment for individuals. Its formula divides total weight by height squared. Every kilogram of tissue counts equally whether it is subcutaneous fat or quadriceps muscle.
BMI = Total Weight (kg) / Height (m)²
FFMI = Fat-Free Mass (kg) / Height (m)²
The only difference between the two formulas is the numerator. BMI uses total weight. FFMI uses fat-free mass. That one change removes the central confound that makes BMI unreliable for anyone with meaningful muscle development.
A concrete example:
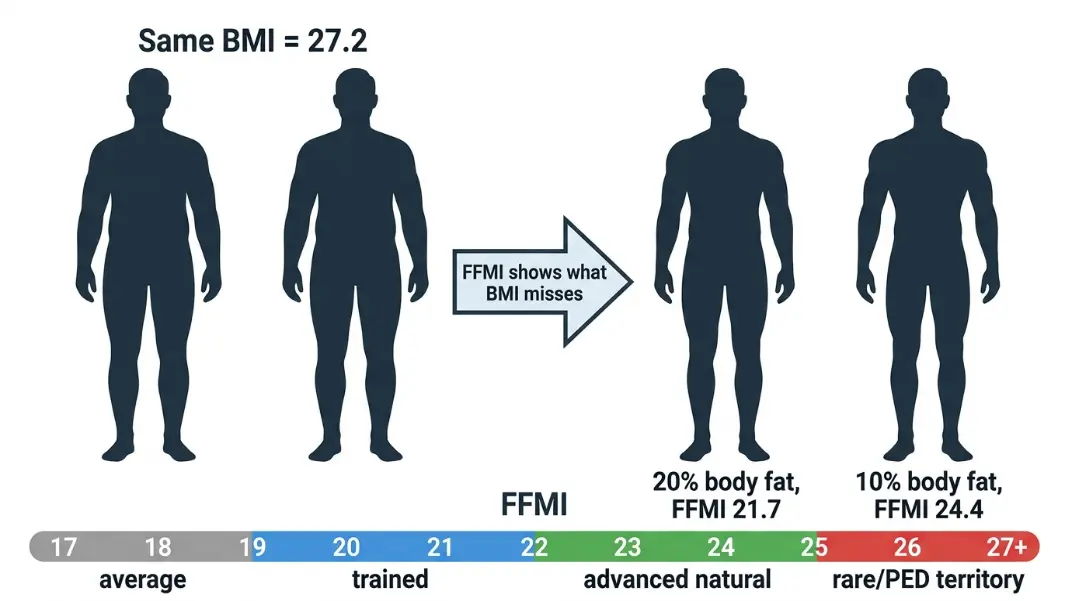
Two males at 5'11" and 195 lbs both have a BMI of 27.2, classified as overweight.
- Person A: 20% body fat. Fat-free mass = 156 lbs = 70.8 kg. Normalized FFMI = 21.7 (above average, dedicated training)
- Person B: 10% body fat. Fat-free mass = 175.5 lbs = 79.6 kg. Normalized FFMI = 24.4 (advanced natural territory)
Same height. Same weight. Same BMI. One carries twice the relative body fat. BMI says identical things about both people. FFMI separates them by 2.7 points on a scale where each point represents years of training difference.
The reverse problem exists at lower body weights. A person who is "normal" BMI but carries low muscle mass and elevated body fat relative to their frame (sometimes described as metabolically obese at normal weight) is metabolically closer to a high-BMI individual than their BMI suggests. FFMI surfaces this: it shows a low score while BMI misses it entirely.
This is similar to why A1C provides more useful information than a single fasting glucose reading for blood glucose management. The A1C Calculator accounts for glucose exposure over three months rather than a single moment, just as FFMI accounts for the composition of body weight rather than just its total. Both replace a cruder aggregate measure with one that accounts for the underlying biology that actually matters.
Using FFMI to Track Body Composition Progress#
Total body weight is a poor tracking metric during a lean bulk because it cannot distinguish muscle gain from fat gain. Two people gaining weight at the same rate can be doing completely different things. FFMI, measured at consistent intervals with consistent body fat measurement, isolates the lean mass component specifically.
Measurement intervals that produce useful signal:
FFMI in trained individuals changes slowly. Monthly measurement adds noise rather than signal because normal daily fluctuations in water retention and glycogen storage are larger than real monthly lean mass changes. The most practical interval is every 3 to 4 months.
Consistency in body fat measurement method matters more than method accuracy. If you use calipers, use the same sites, same technician, same time of day, and same hydration state each time. If you use DEXA, scan under consistent conditions. The goal is minimizing measurement variability so that FFMI changes reflect real lean mass changes rather than measurement drift.
A realistic progression for a natural male starting from untrained:
| Training Year | Typical FFMI Gain | Resulting FFMI Range |
|---|---|---|
| Year 1 | 3.0 to 4.0 points | 19 to 20 |
| Year 2 | 1.5 to 2.5 points | 21 to 22 |
| Years 3 to 4 | 0.8 to 1.5 points | 22 to 23 |
| Years 5 to 7 | 0.3 to 0.8 points | 23 to 24 |
| Year 8 onward | 0.1 to 0.3 points | Approaching individual ceiling |
The deceleration in yearly FFMI gains is not a failure of training or nutrition. It reflects approaching a physiological limit. If your FFMI gains are slowing after several years of consistent work, you are on a normal curve, not behind.
One important use of FFMI that many guides skip: tracking leans cuts and regains. During a calorie deficit, total weight drops but the question is how much is fat and how much is muscle. Comparing FFMI before and after a cut shows whether lean mass was preserved. An unchanged or minimally decreased FFMI after a cut that reduced body fat by several percentage points is a successful outcome. A significantly lower FFMI means the deficit was too aggressive or protein intake was insufficient.
For aerobic fitness assessed alongside your lean mass score, the VO2 Max Calculator estimates aerobic capacity from submaximal test data. FFMI and VO2 max together give a more complete fitness profile than either number alone.
FFMI (Fat-Free Mass Index) measures lean body mass relative to height. The formula is: fat-free mass (kg) divided by height (m) squared. Fat-free mass equals total weight times (1 minus body fat percentage). Most calculators apply a normalization adjustment of 6.1 times (1.80 minus height in meters) to standardize scores across heights. A normalized FFMI of 22 indicates a well-trained natural athlete. Above 25 is rare without performance-enhancing drugs based on the Kouri et al. 1995 research. Body fat percentage is the most critical input: a 5-point error shifts FFMI by roughly 1.3 points.
For males, a normalized FFMI between 19 and 21 reflects above-average lean mass from consistent training. A score of 21 to 23 indicates dedicated multi-year training. A score of 23 to 25 is advanced natural bodybuilder territory and represents the upper range most natural athletes can reach. Above 25 is rare without performance-enhancing drug use. Female FFMI scores run 3 to 4 points lower at equivalent training levels. Female scores above 21 to 22 represent the equivalent of advanced natural territory for women.
The Kouri et al. 1995 study found no confirmed natural male athlete exceeded a normalized FFMI of 25. This has become the widely cited natural ceiling, though a small number of genetic outliers may reach 25 to 26 naturally. Most natural athletes approach their genetic maximum somewhere in the 23 to 25 range after 8 to 10 years of optimized training. Scores above 28 are not considered physiologically achievable without significant pharmacological support of anabolic signaling.
Both use the same height-squared denominator, but the numerators differ. BMI divides total body weight by height squared. FFMI divides only fat-free mass (lean tissue) by height squared. This difference removes the flaw that makes BMI unreliable for trained individuals: BMI cannot distinguish muscle from fat. Two people at identical height and weight have identical BMIs regardless of body composition. FFMI separates them based on lean mass, producing scores that reflect training status and body composition rather than just weight-to-height ratio.
You need a measured body fat percentage, not a rough estimate. DEXA scan is the most accessible accurate option, with a 2 to 3% error range. Skinfold calipers with an experienced technician are acceptable at 3 to 4%. BIA home scales are the least reliable at 4 to 8% error depending on hydration. A 5-point body fat error on a 185 lb person shifts lean mass by about 9 lbs and moves the FFMI score by roughly 1.3 points, enough to change the category. For tracking progress over time, consistency of method matters more than method precision.
Yes. The FFMI formula works for women using the same calculation, but score interpretation uses different reference ranges. Female FFMI scores run approximately 3 to 4 points lower than males at equivalent training levels because women have higher essential fat percentages and different lean mass distribution. A female normalized FFMI of 17 to 19 is above average. A score of 19 to 21 reflects consistent dedicated training. Above 21 to 22 is competitive amateur level for women. The natural ceiling for females is roughly 21 to 22, lower than the male threshold of 25.
Written by
Hassaan Rasheed
Web Developer & Content Researcher
Hassaan builds calculators and writes source-linked guides across the site's subject areas. Calculator methods and reference data are documented in each guide so readers can verify the underlying sources.
About the author and methods