IRR vs ROI vs Equity Multiple: Choosing the Right Return Metric (2026)
IRR, ROI, and equity multiple measure different things. Which to use for real estate and private equity, and when the three metrics conflict.
Three numbers appear on almost every real estate and private equity deal memo: IRR, ROI, and equity multiple. Investors sometimes treat them as different ways of expressing the same outcome. They are not. Each metric captures a different dimension of investment performance, and relying on any one of them alone leaves a gap in the analysis.
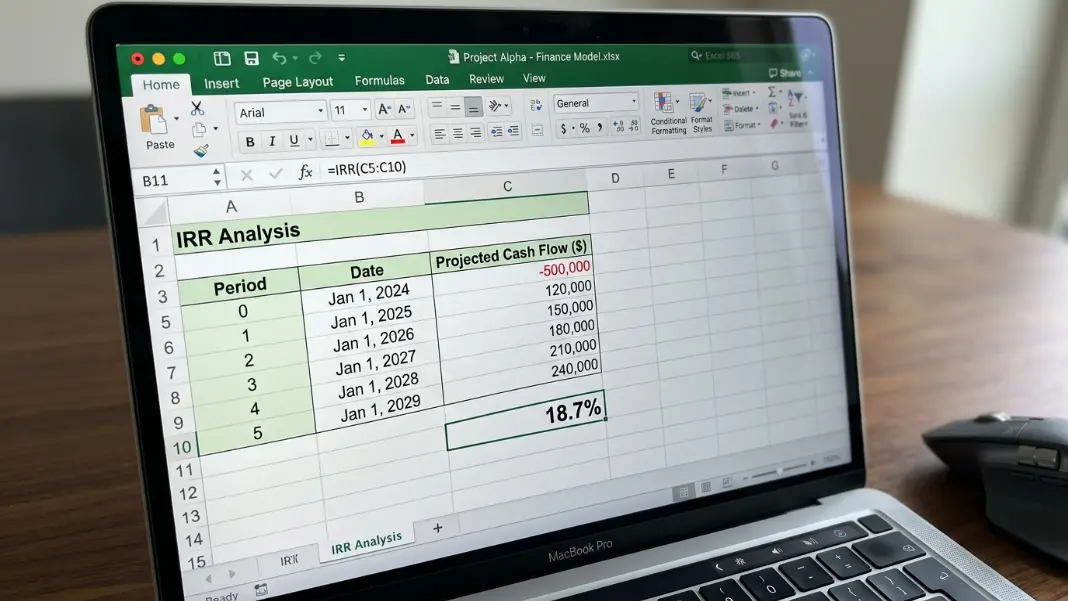
The IRR Calculator outputs IRR, equity multiple, and NPV simultaneously for any cash flow series. Understanding what each metric measures and what it misses is what makes those numbers actionable rather than just impressive-looking.
ROI: The Simplest Return Measure and Its Blind Spot
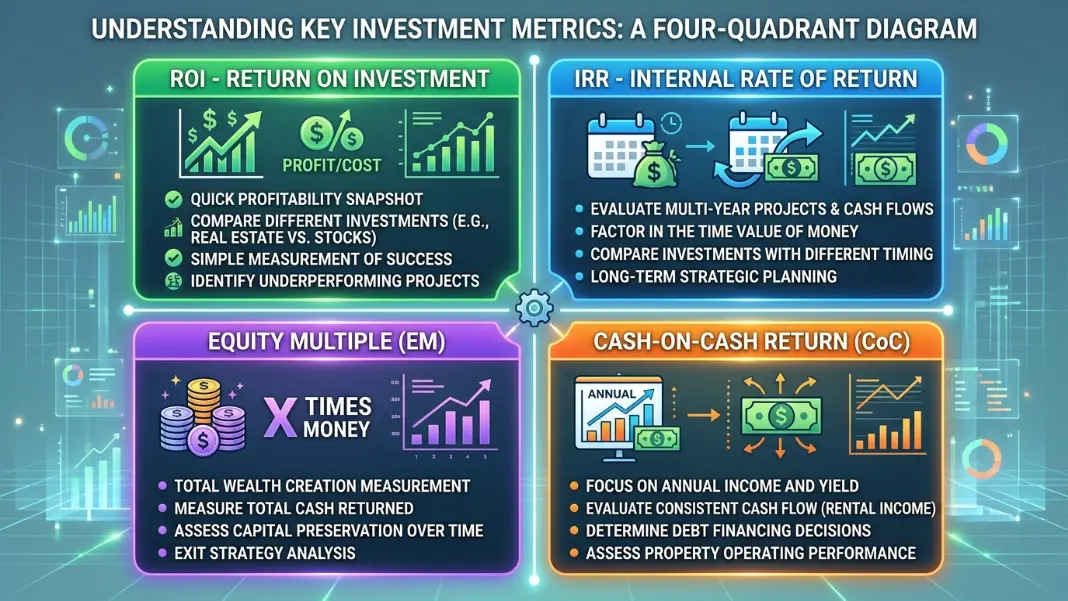
Return on Investment (ROI) is the oldest and most commonly understood return metric.
ROI = (Total Profit / Capital Invested) x 100

Example:
Capital invested: $100,000
Total profit received: $40,000
ROI = ($40,000 / $100,000) x 100 = 40%
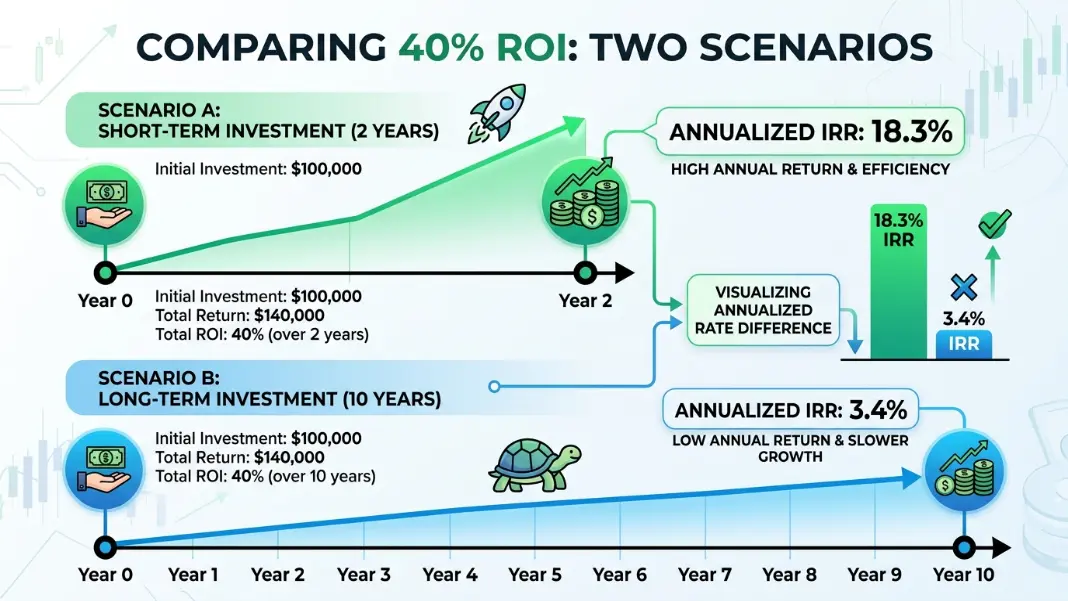
ROI tells you how much you earned relative to what you put in, expressed as a percentage of initial capital. It is intuitive and fast to calculate. The problem is that it ignores time entirely.
A 40% ROI over 2 years and a 40% ROI over 10 years are both "40% ROI." But they are completely different outcomes for your actual wealth and capital efficiency. The 2-year version returned 40% and freed your capital to be redeployed. The 10-year version locked up your capital for a decade to earn the same total percentage.
ROI is most useful for quick comparisons when you already know the holding period is the same across the investments you are evaluating. The moment holding periods differ (which is almost always the case in real estate), ROI becomes misleading without adjustment.
Total return vs cash-on-cash: ROI uses total profit across the full hold period. It captures appreciation at exit, loan paydown, and all income. This is different from cash-on-cash return, which only measures annual income relative to equity. Both are called "ROI" in casual usage, so confirm which definition is being used before comparing numbers across deals.
IRR: What Time Does to a Return
IRR fixes the time problem by expressing the annualized return rate, accounting for exactly when each cash flow arrives.
The same 40% ROI over different holding periods produces dramatically different IRR values:
40% ROI over 2 years:
IRR = (1 + 0.40)^(1/2) - 1 = approximately 18.3% annualized

40% ROI over 10 years:
IRR = (1 + 0.40)^(1/10) - 1 = approximately 3.4% annualized
The 2-year deal delivers nearly six times the annualized return for the same total percentage. IRR converts ROI into a time-adjusted metric, putting every investment on the same footing regardless of how long it takes.
This is why IRR is the standard return metric in private equity and institutional real estate. Fund managers hold multiple investments at once with different durations. Comparing them on annualized IRR puts every position on the same basis regardless of hold period. The IRR vs NPV Guide covers the companion question of when NPV is a more reliable metric than IRR for capital allocation decisions.
IRR's own blind spot: IRR is a percentage and ignores scale. A 30% IRR on a $50,000 investment creates $15,000 in profit per year. A 12% IRR on a $1,000,000 investment creates $120,000. IRR ranks the small investment higher. Your balance sheet ranks the large investment higher.
Equity Multiple: The Number That Shows Total Wealth Created
Equity multiple, also called MOIC (Multiple on Invested Capital) in private equity, captures what IRR misses: how many times over you got your capital back.
Equity Multiple = Total Cash Received / Capital Invested

Example:
Capital invested: $200,000
Total cash received over 5 years: $500,000
Equity Multiple = $500,000 / $200,000 = 2.5x
A 2.5x equity multiple means you received $2.50 for every dollar invested, regardless of when those dollars arrived. It does not care whether returns came in year 1 or year 5. It tells you the total return as a multiple of initial capital.
The equity multiple is most useful as a cross-check on IRR. The two metrics together tell a more complete story than either alone.
The table below shows how IRR and equity multiple interact across different investment scenarios.
| Capital | Hold | IRR | Equity Multiple | Total Profit |
|---|---|---|---|---|
| $100K | 2 years | 40% | 1.96x | $96K |
| $100K | 5 years | 20% | 2.49x | $149K |
| $100K | 10 years | 15% | 4.05x | $305K |
| $1M | 5 years | 14% | 1.93x | $930K |
The last row shows exactly why equity multiple matters for capital allocation. The $1M deal at 14% IRR produces $930K in total profit over 5 years. The $100K deal at 20% IRR produces $149K. IRR says the smaller deal is better. Equity multiple and profit column show what the money is actually doing.
High IRR, low equity multiple: This combination signals a short hold with limited absolute wealth creation. A 1.4x equity multiple over 1 year with a 40% IRR returned $40,000 on a $100,000 investment. Impressive percentage; limited real impact.
Lower IRR, high equity multiple: This often signals a long hold with significant wealth creation. A 15% IRR over 10 years produces a 4x equity multiple. The annualized rate is moderate; the total wealth created is substantial.
Cash-on-Cash Return vs IRR in Real Estate
Real estate adds a fourth metric: cash-on-cash return (CoC). This measures the annual pre-tax cash income relative to equity invested.
Cash-on-Cash Return = Annual Pre-Tax Cash Flow / Equity Invested

Example:
Annual net operating income after debt service: $18,000
Equity invested: $150,000
Cash-on-Cash = $18,000 / $150,000 = 12%
Cash-on-cash only captures the annual income yield. It ignores appreciation, loan paydown, and exit proceeds entirely. IRR captures all of these over the full hold period and treats them with proper time-weighting.
A property with 5% cash-on-cash in early years but substantial appreciation at exit can produce a 16% IRR. A property with 12% cash-on-cash but no appreciation might produce a 10% IRR over the same period despite much higher annual income.
The Cap Rate Calculator handles the unleveraged income yield (cap rate) at the property level. Cash-on-cash is the levered income yield on your equity after debt service. IRR is the total levered equity return including exit. These are three different cuts of the same investment's performance, each useful for different questions.
For income-focused investors who need current yield to cover expenses or investor distributions, cash-on-cash is the most directly relevant metric. For investors building long-term wealth through appreciation and equity paydown, IRR tells the complete story over the hold period.
Which Metric to Use for Each Type of Decision
Each metric has specific situations where it outperforms the others.
Use ROI when: you need a quick back-of-envelope comparison between investments with identical or very similar holding periods. Fast to calculate, easy to communicate, and sufficient when timing is not a variable.
Use IRR when: comparing investments with different holding periods, presenting returns to investors or fund LPs, benchmarking against other deals in the same strategy, or evaluating whether an investment clears a hurdle rate on an annualized basis. IRR is the industry standard for institutional real estate and private equity.
Use equity multiple when: evaluating whether a deal creates meaningful absolute wealth alongside a high IRR, cross-checking whether a high IRR reflects real profit or just a short hold, or comparing long-hold real estate against shorter-duration private equity deals where IRR comparisons can be misleading.
Use cash-on-cash when: evaluating current income yield on a rental property, assessing whether annual income covers operating expenses with a margin of safety, or making decisions for income-focused strategies where near-term distributions matter.
Most deal memos and fund reports show IRR alongside equity multiple precisely because neither alone is sufficient. The IRR Calculator outputs both metrics simultaneously so you can run the full analysis on any investment without switching between tools.
ROI measures total profit as a percentage of capital invested, ignoring how long the investment took. IRR measures the annualized return rate, accounting for both profit and time. A 40% ROI over 2 years is approximately 18% IRR. The same 40% ROI over 10 years is approximately 3.4% IRR. IRR is more useful for comparing investments with different holding periods. ROI is simpler and works for quick comparisons when holding periods are the same.
Equity multiple (also called MOIC, Multiple on Invested Capital) is total cash received divided by capital invested. A 2.5x equity multiple means you received $2.50 for every $1 invested, regardless of timing. It is a companion metric to IRR in private equity. IRR shows the annualized return rate; equity multiple shows the total wealth multiplier. A 2.5x equity multiple over 5 years at 20% IRR represents consistent compounding over a meaningful hold period.
A high IRR can be misleading in two ways. First, small investment scale: a 35% IRR on $20,000 creates $7,000 in profit, far less than a 14% IRR on $500,000 which creates $70,000. Second, short hold period: returning capital in 12 months at a modest absolute profit produces a high annualized rate that may not reflect a meaningful outcome. Always check equity multiple alongside IRR to confirm the percentage translates into real absolute wealth creation.
Cash-on-cash return measures annual income yield (annual cash flow after debt service divided by equity invested). It ignores appreciation, loan paydown, and exit proceeds. IRR measures total annualized equity return over the full hold period, including all cash flows and sale proceeds with proper time-weighting. A property can have a low cash-on-cash return in early years but a high IRR if it appreciates significantly at exit. For income-focused strategies, cash-on-cash is most relevant. For total return analysis, IRR is the right metric.
Both are reported on every institutional deal because neither alone is sufficient. IRR shows the annualized return rate and is used for benchmarking and fund comparisons. Equity multiple shows the total wealth multiplier and is used to assess absolute return regardless of timing. A 25% IRR on a 2-year deal produces only a 1.6x equity multiple, while a 15% IRR on a 5-year deal produces a 2.0x. LPs evaluate both: high IRR for capital efficiency and high equity multiple for meaningful total wealth creation.
You cannot calculate equity multiple directly from IRR alone; you also need the holding period. For a single lump-sum investment and one final return with no interim cash flows: Equity Multiple = (1 + IRR)^n, where n is the holding period in years. For a 15% IRR over 5 years: (1.15)^5 = 2.01x. For investments with annual cash flows, calculate the actual total cash received and divide by capital invested, since the IRR formula does not preserve the path of individual cash flows.
Written by
Hassaan Rasheed
Web Developer & Content Researcher
Hassaan builds calculators and writes research-backed guides on finance, math, payroll, and construction topics. Every number in his articles is sourced from official data and worked through by hand.
View LinkedIn Profile