Toddler Weight and Height Percentile Chart: Ages 2 to 5 (2026)
Toddler weight and height percentile chart for ages 2 to 5: WHO reference values by sex, how growth changes after 24 months, and what to track.
Toddler Weight and Height Percentile Calculator (Ages 2–5)
WHO Child Growth Standards, ages 2 to 5 years.
On this WHO weight-for-age chart, this measurement is heavier than approximately 50% of the reference population with the same age and sex. A single percentile is not a diagnosis; clinicians assess repeated measurements and the full growth pattern.
| 3rd | 5th | 10th | 25th | 50th | 75th | 90th | 95th | 97th |
|---|---|---|---|---|---|---|---|---|
| 11.44 kg | 11.77 kg | 12.29 kg | 13.22 kg | 14.34 kg | 15.57 kg | 16.77 kg | 17.53 kg | 18.05 kg |
Sources: WHO weight-for-age and length/height-for-age standards. Calculated from the published monthly LMS parameters for completed whole months. Weight-for-age alone does not classify underweight or overweight. Reference tool only — not medical advice.
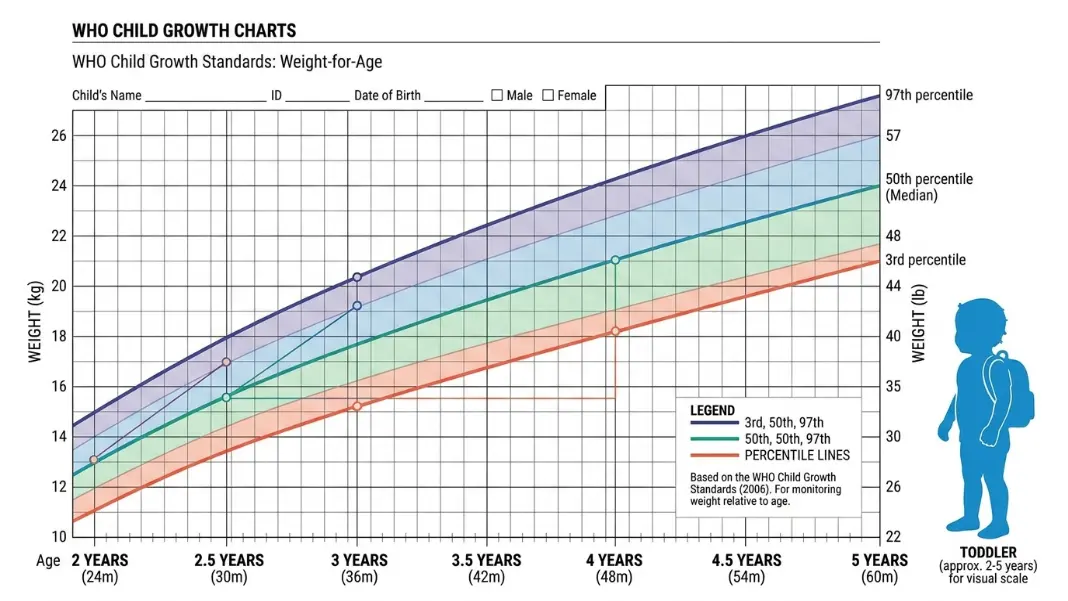
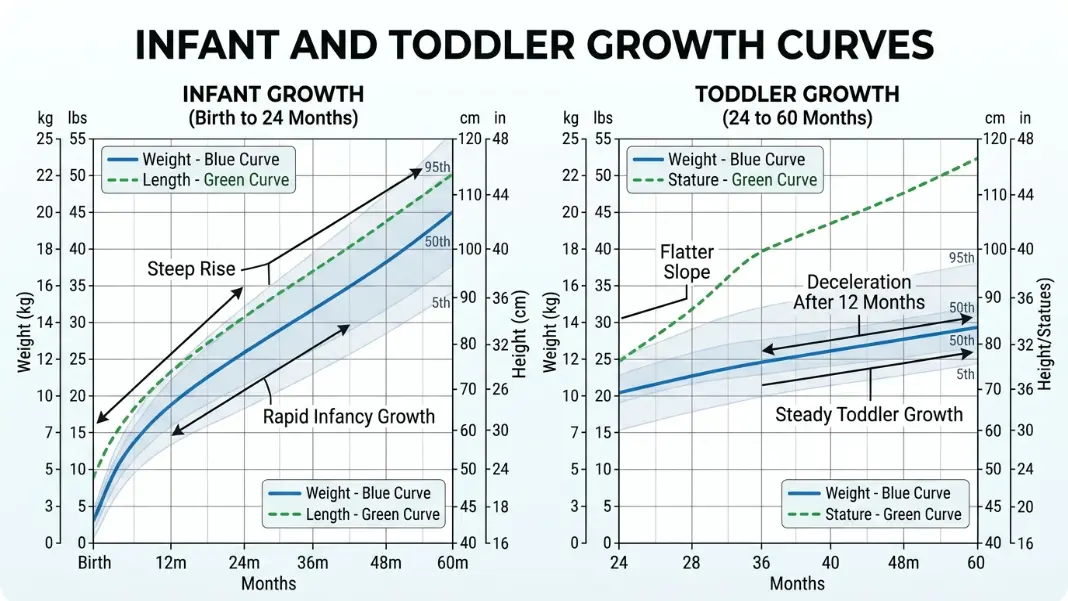
At age 2, the pediatric growth chart changes. The WHO Multicentre Growth Reference Study covers birth to 60 months, and the 24-month mark is where the transition from infant charts to toddler charts occurs. Growth slows noticeably, the relationship between weight and height begins to matter more than weight alone, and the reference curves take on a different shape than they had in the rapid-gain first year.
Use the calculator above with your toddler's completed age in months, sex, and measurement to compare it with the WHO standard for ages 2 to 5.
Parents often notice this slowdown at home before they notice it on a chart. A toddler who seemed to add weight quickly as an infant may now go through weeks without visible change. That deceleration is normal and expected. What matters is the trend across visits, not month-to-month fluctuations. For children under two, the infant percentile calculator uses the birth-to-24-month standards instead.
How Toddler Growth Charts Differ From Infant Charts#
The infant growth chart, which covers birth to 24 months, reflects a period of extremely rapid gain. A newborn typically triples their birth weight by 12 months. That pace does not continue. The toddler chart from 24 to 60 months reflects a much steadier, slower gain: roughly 2 to 2.5 kg per year instead of the 6 to 7 kg added across the first year.
The reference charts for infants aged 0 to 24 months are covered in depth in the Baby Weight Percentile Chart by Age guide. The toddler tables in this post run from 24 through 60 completed months. The calculator uses the monthly LMS parameters in the official WHO weight-for-age and length/height-for-age workbooks, rather than interpolating between this article's selected rows.
Several structural differences between the infant and toddler chart are worth understanding.
The measurement method changes:
Infants are measured lying down (recumbent length). Children who can stand reliably, typically from 24 months onward, are measured standing (height). Standing height is on average 0.7 cm less than recumbent length for the same child because of posture and spinal compression. This is why the 24-month standing height value appears slightly lower than the 24-month recumbent length value, even though the child is the same person.
BMI-for-age replaces weight-for-length:
For infants under 24 months, pediatricians use weight-for-length to assess whether weight is proportionate to height. From 24 months onward, the equivalent tool is BMI-for-age. BMI-for-age charts are separate from weight-for-age and height-for-age, and they tell a different story than either individual measurement.
Appetite and eating become more variable:
Toddler eating patterns are erratic in ways that infant intake is not. Neophobia (refusal of new foods), strong food preferences, and highly variable day-to-day intake are developmentally normal from approximately 18 months to 5 years. This appetite variability does not typically translate into abnormal weight gain patterns on a growth chart if the overall diet meets caloric needs, but parents often interpret it as a sign that something is wrong.
WHO Toddler Weight Percentile Chart: Boys Ages 2 to 5#
The following table shows approximate WHO reference weights for boys from 24 to 60 months at five major percentile levels. Values are from WHO Child Growth Standards and have been rounded to one decimal place.
Boys in this age range gain roughly 1.8 to 2.2 kg per year. The spread between the 3rd and 97th percentile widens with age, reflecting the increasing genetic divergence in body composition as toddlers grow.
| Age | 3rd Percentile | 15th Percentile | 50th Percentile | 85th Percentile | 97th Percentile |
|---|---|---|---|---|---|
| 24 months | 9.8 kg | 10.8 kg | 12.2 kg | 13.7 kg | 15.1 kg |
| 30 months | 10.7 kg | 11.8 kg | 13.3 kg | 15.0 kg | 16.6 kg |
| 36 months | 11.4 kg | 12.7 kg | 14.3 kg | 16.3 kg | 18.0 kg |
| 42 months | 12.2 kg | 13.5 kg | 15.3 kg | 17.5 kg | 19.4 kg |
| 48 months | 12.9 kg | 14.3 kg | 16.3 kg | 18.7 kg | 20.9 kg |
| 54 months | 13.6 kg | 15.2 kg | 17.3 kg | 19.9 kg | 22.3 kg |
| 60 months | 14.3 kg | 16.0 kg | 18.3 kg | 21.1 kg | 23.8 kg |
Values are approximate from WHO Child Growth Standards. Clinical growth charts use continuous curves rather than tabular approximations.
Reading the table:
A 3-year-old boy (36 months) at the 50th percentile weighs approximately 14.3 kg (31.5 lb). At the same age, P15 is about 12.7 kg (28.0 lb) and P85 is about 16.3 kg (35.9 lb). These are positions in a weight-for-age distribution, not cutoffs that diagnose adequate or excessive weight.
Expected gain per 6-month interval:
A boy at the 50th percentile gains roughly 1.1 kg between 24 and 30 months, and approximately 1.0 to 1.1 kg per 6-month period through age 5. If the actual gain over a 6-month visit interval is substantially less than 1 kg without an obvious cause like illness, that is worth raising with your pediatrician.
WHO Toddler Weight Percentile Chart: Girls Ages 2 to 5#
The WHO provides separate girls' and boys' curves because the location and shape of their reference distributions differ across these ages.
The table below shows approximate WHO reference weights for girls from 24 to 60 months at the same five percentile levels.
| Age | 3rd Percentile | 15th Percentile | 50th Percentile | 85th Percentile | 97th Percentile |
|---|---|---|---|---|---|
| 24 months | 9.2 kg | 10.1 kg | 11.5 kg | 13.1 kg | 14.6 kg |
| 30 months | 10.1 kg | 11.2 kg | 12.7 kg | 14.5 kg | 16.2 kg |
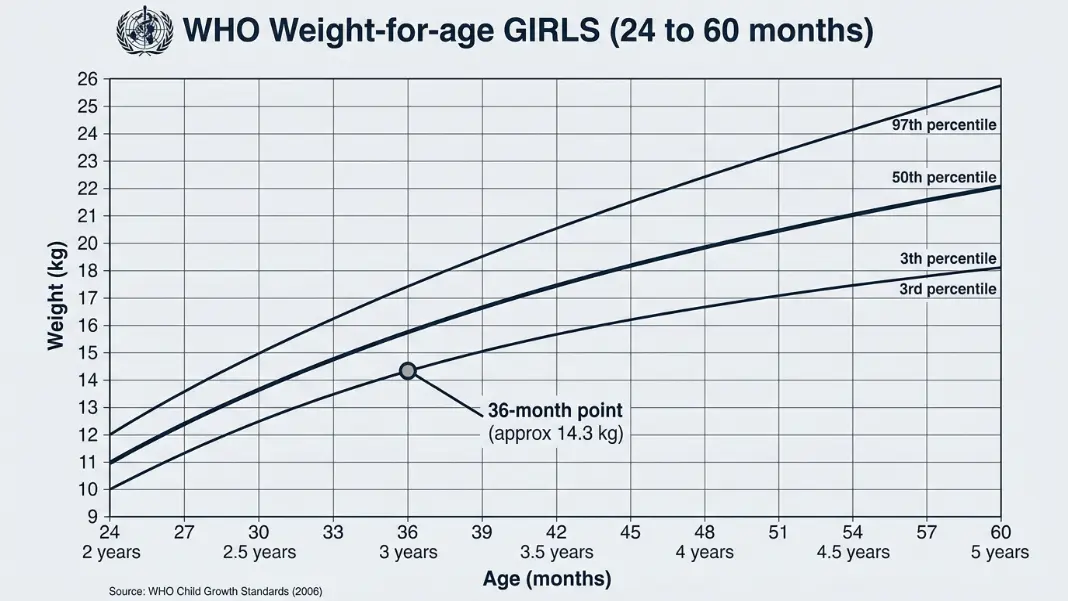
| 36 months | 11.0 kg | 12.1 kg | 13.9 kg | 15.9 kg | 17.8 kg |
| 42 months | 11.8 kg | 13.1 kg | 15.0 kg | 17.3 kg | 19.5 kg |
| 48 months | 12.5 kg | 14.0 kg | 16.1 kg | 18.6 kg | 21.1 kg |
| 54 months | 13.2 kg | 14.8 kg | 17.2 kg | 20.0 kg | 22.8 kg |
| 60 months | 14.0 kg | 15.7 kg | 18.2 kg | 21.3 kg | 24.4 kg |
Values are approximate from WHO Child Growth Standards.
3-year-old girl reference point:
A 3-year-old girl at the 50th percentile weighs approximately 13.9 kg (30.6 lb). The frequently searched question "what is average weight for a 3-year-old girl" is answered precisely by the 50th percentile value at 36 months.
The spread widens at higher percentiles:
At 24 months, the difference between the girls' P50 and P97 reference values is about 3.1 kg. At 60 months it is about 6.2 kg. This describes the changing shape of the WHO reference distribution; it does not identify the cause of any individual child's measurement.
WHO Height Percentile for Toddlers Ages 2 to 5#
Height gain in the toddler years is more linear and less variable than weight gain. Boys and girls gain roughly 7 to 8 cm per year between ages 2 and 5. The sex difference in height is smaller in this age range than it becomes after puberty.
The table below shows approximate WHO standing height values for boys and girls separately at the 3rd, 50th, and 97th percentiles.
| Age | Boys 3rd | Boys 50th | Boys 97th | Girls 3rd | Girls 50th | Girls 97th |
|---|---|---|---|---|---|---|
| 24 months | 81.4 cm | 87.1 cm | 92.9 cm | 79.6 cm | 85.7 cm | 91.8 cm |
| 36 months | 89.1 cm | 96.1 cm | 103.1 cm | 87.9 cm | 95.1 cm | 102.2 cm |
| 48 months | 95.4 cm | 103.3 cm | 111.2 cm | 94.6 cm | 102.7 cm | 110.8 cm |
| 60 months | 101.2 cm | 110.0 cm | 118.7 cm | 100.5 cm | 109.4 cm | 118.4 cm |
Values are approximate from WHO Child Growth Standards.
Reading the height table:
A 4-year-old boy (48 months) at the 50th percentile stands approximately 103.3 cm (40.7 inches, or about 3 feet 5 inches). A 4-year-old girl at the 50th percentile stands approximately 102.7 cm (40.4 inches). The sex difference at this age is less than 1 cm at the median.
Height velocity:
Between 24 and 36 months, the boys' P50 reference increases by about 9.0 cm. Between 36 and 48 months it increases by about 7.2 cm, and from 48 to 60 months by about 6.7 cm. An individual child's height velocity should be calculated from accurate serial measurements and interpreted by a clinician; it is not the same thing as subtracting two population centiles.
Why height and weight percentiles differ:
Weight-for-age and height-for-age can plot at different percentiles, but their numerical gap should not be used to label a child lean or heavy. From age 2, BMI-for-age directly relates weight to standing height and is interpreted with the wider clinical picture.
What Toddler Percentile Shifts Mean and When to Discuss Them#
Understanding what the percentile lines represent, and why change across visits needs context, is central to interpreting toddler growth monitoring. A toddler who tracks near the same centile and one whose plotted position changes substantially present different patterns. Neither weight-for-age position alone establishes whether growth is adequate; measurement quality, height/BMI-for-age, development, diet, and health history matter.
Crossing two major centile spaces downward is one screening pattern used in some growth-faltering guidance. It should prompt review of the measurements and clinical context, not an automatic diagnosis. The exact centile spaces and action thresholds depend on the chart and local guideline.
Why natural shifts happen in the toddler years:
Some children change centile position during the transition from infancy, but breastfeeding, solid foods, or genetics should not be assumed to explain an individual change. Measurement technique also changes around age 2. Review any substantial shift with diet, development, symptoms, and the child's clinician.
When to bring it up:
The most useful signals to share with a pediatrician are:
- A substantial downward shift across repeated, accurate measurements
- A weight that plateaus or drops while height continues to increase (weight stagnation)
- A clear change in height velocity
- A sudden upward shift across multiple lines
Repeated measurements usually provide more context than one point, but a single result should not be dismissed when weight loss, poor intake, persistent symptoms, or developmental concerns are present.
For a detailed explanation of what the individual percentile lines on any growth chart represent and how to read a trend across visits, the What Does Baby Percentile Mean guide covers the WHO reference system from the 3rd to the 97th percentile and explains the clinical framework pediatricians use to interpret growth data.
Factors that affect toddler weight percentile:
Genetics, diet, activity, health, and measurement variation can all affect where a child plots. Family size is useful context, but it cannot by itself prove that a particular trajectory is healthy or unhealthy.
The percentile is not a grade, and the median is not a target. A stable curve can be useful context, but it does not override symptoms, development, BMI-for-age, or clinical assessment. The 50th Percentile Baby explains why P50 is simply the reference midpoint.
The WHO median at 36 months is approximately 14.3 kg (31.5 lb) for boys and 13.9 kg (30.6 lb) for girls. At that age the P3-to-P97 reference values are about 11.4 to 18.0 kg for boys and 11.0 to 17.8 kg for girls. These are descriptive weight-for-age centiles, not a guaranteed healthy-weight range.
There is no ideal weight-for-age percentile and no percentile band that can guarantee health. The value is one descriptive measurement. Clinicians also review the trajectory, standing height, BMI-for-age from age 2, development, diet, and medical history.
The WHO standards cover birth to 60 months, but measurement practice changes at age 2: recumbent length gives way to standing height, and BMI-for-age replaces weight-for-length for proportionality assessment. The weight-for-age curves also rise much more slowly after infancy.
At 48 months, the WHO median standing height is approximately 103.3 cm (40.7 inches) for boys and 102.7 cm (40.4 inches) for girls. The P3-to-P97 reference values are about 95.4 to 111.2 cm for boys and 94.6 to 110.8 cm for girls.
Discuss a substantial change from the child's earlier trajectory, weight loss, poor intake, persistent symptoms, or any concern about growth or development with the child's clinician. A single result can reflect measurement error, but it should not be dismissed automatically—especially when symptoms or feeding concerns are present.
The WHO median curves rise more slowly after infancy. From 24 to 60 months, the boys' median increases from 12.2 to 18.3 kg (about 2.0 kg per year across that interval), while the girls' median increases from 11.5 to 18.2 kg (about 2.2 kg per year). These population-curve differences are not individual weight-gain prescriptions.
Written by
Hassaan Rasheed
Web Developer & Content Researcher
Hassaan builds calculators and writes source-linked guides across the site's subject areas. Calculator methods and reference data are documented in each guide so readers can verify the underlying sources.
About the author and methods