Baby Weight Percentile Chart by Age: WHO Reference Tables (2026)
Baby weight percentile chart with WHO reference values birth to 24 months. Complete tables for boys and girls, 3rd to 97th percentile, by month.
Most baby percentile guides explain what percentile means but never show you the actual numbers. This one does. The tables below come from the WHO Child Growth Standards (2006), the same reference used by pediatricians and health departments worldwide. They show reference weights at five percentile levels for boys and girls from birth to 24 months.
The Baby Percentile Calculator uses the full WHO tables including 9 percentile levels and allows exact age input in months. For tracking across well-child visits, the calculator runs the comparison instantly. The tables here are useful for reading a growth chart printed at a pediatric appointment, checking whether your baby's weight falls within the typical range for their age, or preparing questions before a visit.
WHO Baby Boy Weight Percentile Chart: Birth to 24 Months
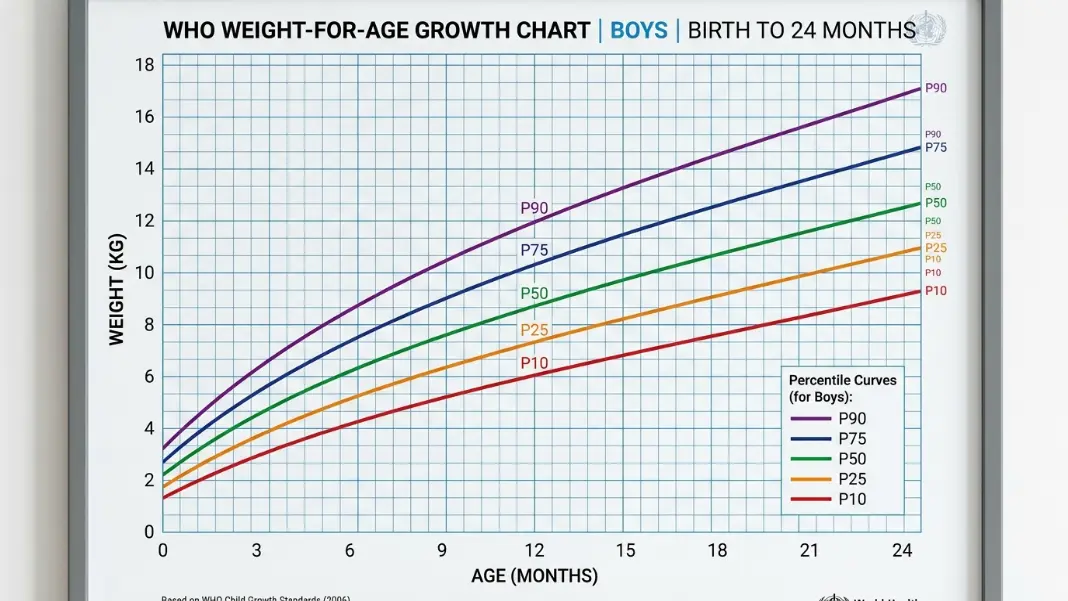
These are WHO weight-for-age reference values for boys. The P50 is the median: half of boys in the reference population weigh more, half weigh less. P10 and P90 are the approximate lower and upper boundaries of the normal range most commonly cited by clinicians.
Boys weight-for-age reference (kg) at selected percentile levels:
| Age | P10 | P25 | P50 | P75 | P90 |
|---|---|---|---|---|---|
| Birth | 2.8 | 3.0 | 3.3 | 3.7 | 4.0 |
| 1 month | 3.9 | 4.3 | 4.8 | 5.3 | 5.7 |
| 2 months | 4.8 | 5.3 | 5.9 | 6.6 | 7.0 |
| 3 months | 5.5 | 6.0 | 6.6 | 7.2 | 7.7 |
| 4 months | 6.1 | 6.6 | 7.2 | 7.9 | 8.4 |
| 5 months | 6.5 | 7.1 | 7.7 | 8.4 | 9.0 |
| 6 months | 6.9 | 7.4 | 7.9 | 8.6 | 9.1 |
| 9 months | 7.9 | 8.5 | 9.0 | 9.7 | 10.3 |
| 12 months | 8.4 | 9.0 | 9.6 | 10.2 | 10.8 |
| 18 months | 9.6 | 10.2 | 10.9 | 11.7 | 12.4 |
| 24 months | 10.8 | 11.5 | 12.2 | 12.9 | 13.6 |
The WHO also publishes reference values for the 3rd and 97th percentile levels, which are the outer boundary markers. A boy below the 3rd percentile at any age is below the WHO outer reference range on the lower end. At birth the 3rd percentile weight for boys is approximately 2.5 kg (5.5 lb). At 24 months it is approximately 10.2 kg (22.5 lb).
Reading the table in practice:
A 6-month-old boy weighing 7.2 kg falls between the P10 (6.9 kg) and the P25 (7.4 kg) reference values, placing him in roughly the 15th to 25th percentile band. He is in the lower portion of the normal range. A 12-month-old boy weighing 11.1 kg falls between P75 (10.2 kg) and P90 (10.8 kg) and above it, placing him near the 90th percentile. Both are within the clinically normal range as long as their trajectories are consistent.
WHO Baby Girl Weight Percentile Chart: Birth to 24 Months
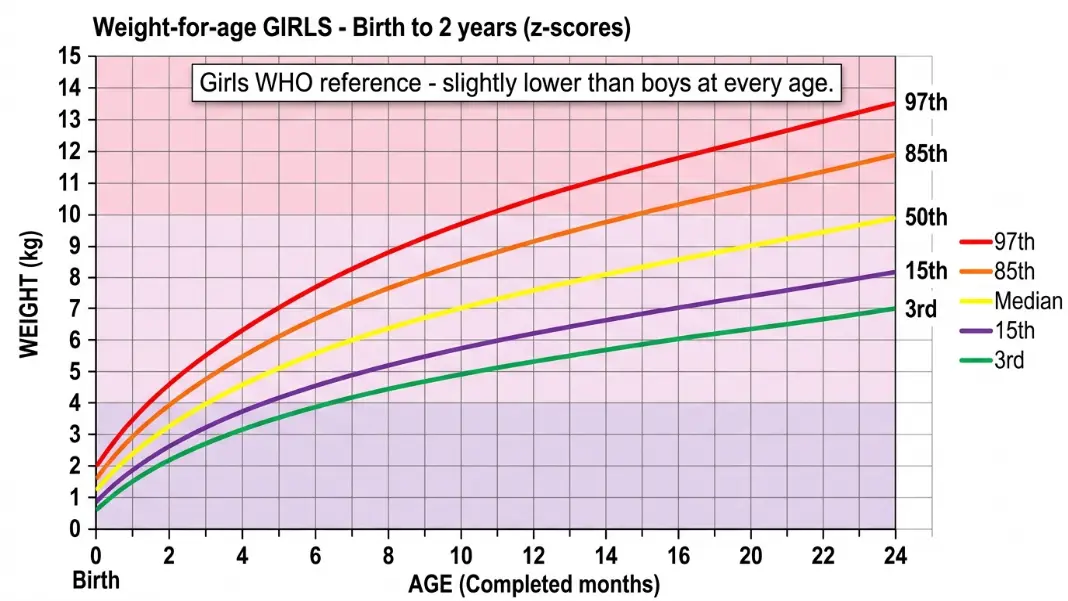
Girls grow at a slightly different rate than boys throughout infancy, with lower median weights at every age. The WHO reference values for girls are derived from the same multinational study population as the boys tables but are calculated separately.
Girls weight-for-age reference (kg) at selected percentile levels:
| Age | P10 | P25 | P50 | P75 | P90 |
|---|---|---|---|---|---|
| Birth | 2.7 | 2.9 | 3.2 | 3.5 | 3.8 |
| 1 month | 3.5 | 3.9 | 4.4 | 4.9 | 5.3 |
| 2 months | 4.3 | 4.8 | 5.3 | 5.9 | 6.4 |
| 3 months | 4.9 | 5.4 | 5.9 | 6.5 | 7.0 |
| 4 months | 5.4 | 5.9 | 6.5 | 7.1 | 7.7 |
| 5 months | 5.8 | 6.4 | 7.0 | 7.7 | 8.2 |
| 6 months | 6.3 | 6.8 | 7.3 | 8.1 | 8.6 |
| 9 months | 7.2 | 7.7 | 8.2 | 9.0 | 9.6 |
| 12 months | 7.8 | 8.4 | 9.1 | 10.0 | 10.7 |
| 18 months | 9.0 | 9.7 | 10.4 | 11.3 | 12.1 |
| 24 months | 10.2 | 10.9 | 11.6 | 12.6 | 13.5 |
The girl-boy difference in median weight is small at birth (0.1 kg) and remains modest throughout infancy. At 12 months, the median for girls is approximately 9.1 kg compared to 9.6 kg for boys. The gap narrows again as both approach 24 months.
Why it matters to use the correct sex-specific table:
Using the boys table for a girl will make her appear lower than she is. Using the girls table for a boy will make him appear higher. The sex-specific reference tables are not interchangeable. The Baby Percentile Calculator automatically selects the correct reference table based on the sex input.
WHO Baby Length Percentile Chart: Birth to 24 Months
Length percentile is tracked alongside weight percentile at every well-child visit. A baby can be in a high weight percentile but a low length percentile, or vice versa. The relationship between the two tells a more complete growth story than either measurement alone.
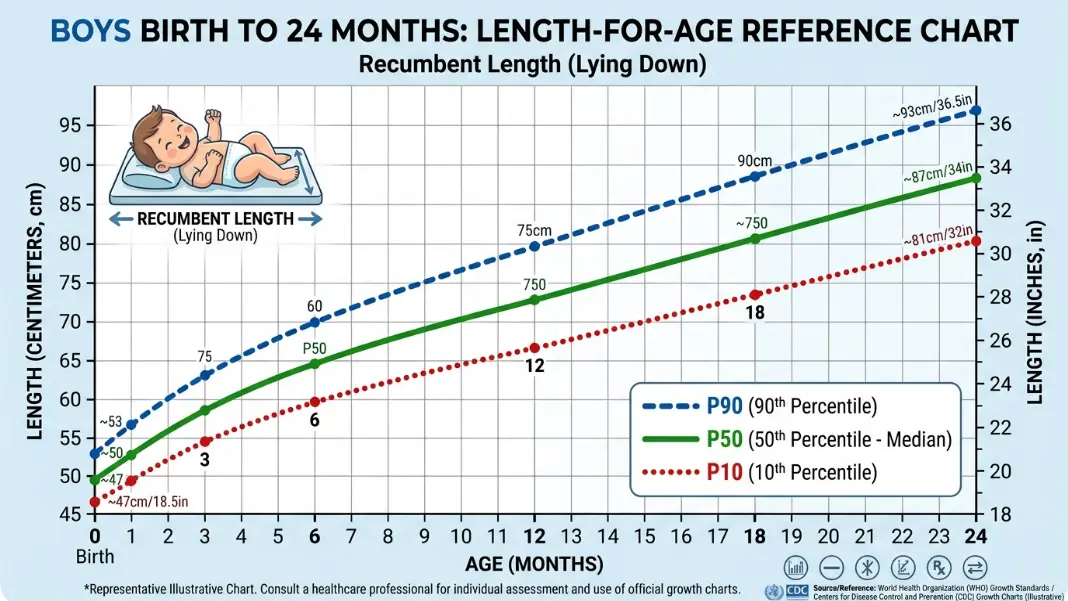
Length is measured lying down (recumbent length) for babies under 24 months. This is slightly different from standing height, which is used from age 2 onward. Recumbent length measurements run 0.5 to 1.0 cm longer than standing height for the same child, which is why the chart uses age-specific references.
Length-for-age P50 reference values (cm) for boys and girls:
These are approximate WHO median values from birth to 24 months.
| Age | Boys P50 Length | Girls P50 Length |
|---|---|---|
| Birth | 50.0 cm (19.7 in) | 49.1 cm (19.3 in) |
| 3 months | 61.0 cm (24.0 in) | 59.8 cm (23.5 in) |
| 6 months | 67.6 cm (26.6 in) | 65.7 cm (25.9 in) |
| 9 months | 72.2 cm (28.4 in) | 70.1 cm (27.6 in) |
| 12 months | 75.7 cm (29.8 in) | 74.0 cm (29.1 in) |
| 18 months | 82.3 cm (32.4 in) | 80.7 cm (31.8 in) |
| 24 months | 87.8 cm (34.6 in) | 86.4 cm (34.0 in) |
The spread from the 10th to the 90th percentile for length is approximately 6 to 8 cm at most ages. A baby who is 3 to 4 cm below the median for length at 12 months is likely in the 15th to 20th percentile, which is well within the normal range.
For more detail on how length percentile is calculated and interpreted alongside weight, the What Does Baby Percentile Mean guide covers the full reference framework including how weight and length percentiles are tracked together and what a gap between them indicates.
How to Use a Baby Percentile Chart at Home Between Visits
The primary use of the growth chart outside a clinical setting is reassurance and preparation. Most parents check their baby's weight on a home scale between well-child visits. There are a few things worth knowing before drawing conclusions from that reading.
Home scale accuracy:
Bathroom scales, even digital ones, are designed for adult weights and often have a resolution of 0.1 to 0.2 kg. For a 4-month-old baby weighing 6.5 kg, a 0.2 kg error is a 3% discrepancy, which can shift the apparent percentile by several points. Clinical infant scales are calibrated for weights under 15 kg and have resolution of 10 to 20 grams. If you weigh your baby at home and get a reading that appears lower than expected, consider whether measurement accuracy is the explanation before interpreting the result.
Timing matters within the day:
A baby weighed before a feed weighs less than the same baby weighed after a feed. For a baby who takes 120 to 150 ml per feed, that is a 120 to 150 gram difference. At well-child visits, babies are typically weighed without clothing and at a consistent time, which reduces this variability. At home, try to weigh at the same time of day and in similar conditions for the most comparable reading.
Using the chart to prepare questions:
If your baby's at-home weight places them in a lower percentile than their last clinical measurement, the most useful thing to do is note the reading and the date, weigh again in 1 to 2 weeks, and bring both readings to the next appointment. A single lower reading rarely tells you anything definitive. Two or three readings over a month that all show the same pattern give the pediatrician something to work with.
Converting between lb/oz and kg:
The WHO reference tables use kilograms. Converting from pounds and ounces: 1 pound = 0.454 kg. 1 ounce = 0.028 kg. A baby weighing 17 lb 4 oz equals (17 x 0.454) + (4 x 0.028) = 7.72 + 0.11 = 7.83 kg. The calculator handles this conversion automatically if you select the imperial input option.
When the Baby Percentile Chart Shows a Pattern Worth Discussing
The WHO growth chart is most useful as a trend tracker. A single reading above or below the reference lines does not indicate a problem by itself. A pattern of readings that show consistent drift in one direction across 3 or more visits is when the chart becomes diagnostically useful.
The two-line rule:
The growth literature uses a consistent threshold: dropping two major percentile lines across multiple visits is the pattern most associated with growth faltering. Major lines are the 3rd, 10th, 25th, 50th, 75th, 90th, and 97th. A baby who was in the 50th to 75th band at 2 months and is now in the 10th to 25th band at 6 months has crossed two major lines. That trend, not just the current reading, is what warrants evaluation.
The same logic applies upward, though rapid upward crossing is less commonly concerning. A large rise from a mid-range percentile to above the 95th in a short period is worth mentioning at the next visit.
Comparing weight and length percentiles:
The most clinically informative comparison on the chart is not weight alone but weight relative to length. A baby at the 15th percentile for weight who is also at the 15th for length is proportionately small and almost certainly just a smaller baby. A baby at the 15th for weight who is at the 60th for length has significantly less weight than expected for their size. That gap, particularly when length and weight percentiles diverge by more than 20 to 30 percentile points, is the pattern that generates follow-up discussion at well-child visits.
For a detailed explanation of what extreme percentile readings mean and when the 3rd and 97th thresholds require clinical follow-up, the 99th Percentile Baby: What High and Low Percentiles Mean guide covers both ends of the distribution with specific clinical context.
Preterm babies and adjusted age:
The WHO Growth Standards were built on full-term babies. Preterm babies, particularly those born before 37 weeks, are typically plotted using their corrected gestational age (chronological age minus weeks of prematurity) rather than chronological age, at least until 24 months corrected. A baby born 8 weeks early and now 5 months old chronologically is plotted at 3 months corrected age on the WHO chart. Without this correction, a healthy preterm baby appears to underperform the reference curves when they are actually tracking appropriately for their gestational development.
Normal baby weight percentile is the 5th to 95th percentile at any age, according to the CDC and American Academy of Pediatrics. The WHO uses the 3rd to 97th as its outer reference bounds. The most important factor is not the exact number but whether it is consistent across visits. A baby at the 8th percentile since birth is growing normally. A baby who drops from the 65th to the 8th over three visits has crossed multiple major percentile lines, which warrants a clinical review regardless of where they land.
WHO median weights for boys: birth 3.3 kg, 3 months 6.6 kg, 6 months 7.9 kg, 12 months 9.6 kg, 24 months 12.2 kg. Girls run slightly lower: birth 3.2 kg, 3 months 5.9 kg, 6 months 7.3 kg, 12 months 9.1 kg, 24 months 11.6 kg. These are medians, not targets. Half of healthy babies weigh more and half weigh less. A baby weighing 20% below the median at a given age may be completely healthy if they have been consistently tracking at that level since birth.
The WHO Child Growth Standards are published at the WHO website as downloadable PDF charts and Excel tables, available for free. They include weight-for-age, length-for-age, weight-for-length, and head circumference-for-age charts for boys and girls from birth to 24 months. The Baby Percentile Calculator uses the same WHO data and calculates the percentile estimate automatically, which is faster for tracking across multiple visits than reading the chart by hand.
The 50th percentile means your baby weighs more than exactly half of WHO reference babies the same age and sex. It is the median, which many people interpret as ideal or average, but it carries no special clinical significance. A baby at the 20th percentile who has always tracked near the 20th is just as healthy as one at the 50th. A baby at the 50th who drops to the 15th over two visits is more worth investigating than a baby who has been at the 15th their whole infancy. The trend, not the target number, is what matters clinically.
Find your baby's age along the bottom axis and draw a vertical line upward. Find your baby's weight on the left axis and draw a horizontal line across. The point where the two lines intersect falls between two printed percentile curves. The percentile curves are labeled (for example, 10th, 25th, 50th, 75th, 90th). The two curves your baby's measurement falls between define their percentile band. If their weight point falls exactly on one line, that is their percentile. The Baby Percentile Calculator does this automatically and shows the exact estimated percentile.
The WHO publishes separate weight-for-age charts for boys and girls because growth rates differ by sex throughout infancy. Girls have slightly lower median weights at every age: the median at 6 months is 7.3 kg for girls versus 7.9 kg for boys. The 10th to 90th percentile spread is similar between sexes. Using the wrong chart gives a percentile reading that is 5 to 10 percentile points off. Always confirm whether the chart being used is the sex-specific version for your baby.
Written by
Hassaan Rasheed
Web Developer & Content Researcher
Hassaan builds calculators and writes research-backed guides on finance, math, payroll, and construction topics. Every number in his articles is sourced from official data and worked through by hand.
View LinkedIn Profile