What Does Baby Percentile Mean: WHO Chart Explained (2026)
Baby percentile compares your baby's weight or length to WHO reference babies the same age and sex. What the number means, how it's calculated, and what to watch.
The doctor says your baby is in the 30th percentile and moves to the next item on the chart. You nod. Most parents nod and leave without being sure whether that number is reassuring, concerning, or just noise.
Baby percentile is a comparison tool, not a grading system. The Baby Percentile Calculator runs the same comparison used in WHO-trained clinical settings worldwide: your baby's weight or length, their exact age in months, and their sex are matched against the WHO growth reference population of 8,440 healthy babies from 6 countries. A baby at the 30th percentile for weight weighs more than 30% of the reference babies at the same age and sex. That is all it says. It makes no claim about whether that weight is insufficient, ideal, or excessive.
Understanding how the number is produced, and what it genuinely measures versus what it does not, is what makes the well-child visit useful rather than just an exercise in receiving a percentage and nodding.
How Baby Percentile Is Calculated: The WHO Growth Reference
The WHO Child Growth Standards, published in 2006 after a multinational research program spanning a decade, are the global reference for infant and toddler growth from birth to 24 months. The reference population was specifically selected for optimal growth conditions: exclusively or predominantly breastfed for the first 6 months, non-smoking household environments, no significant illness in early infancy, adequate nutrition throughout. The intent was to capture how children grow when nothing is working against them, not how children on average happen to grow given all the variation in real-world conditions.
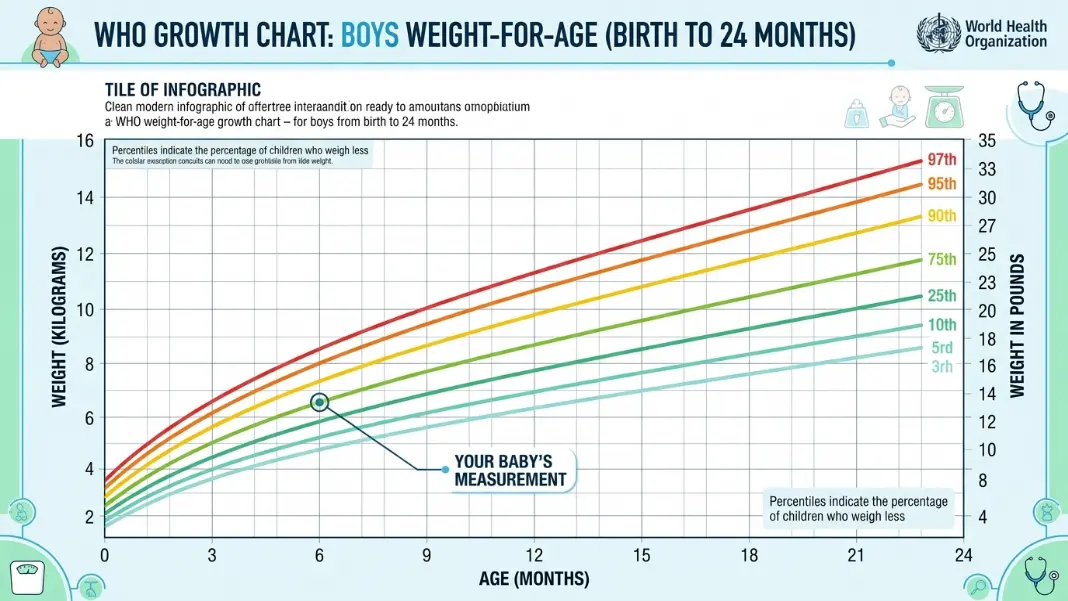
The WHO publishes weight-for-age and length-for-age reference values at 9 percentile levels for each whole month from birth to 24 months: the 3rd, 5th, 10th, 25th, 50th, 75th, 90th, 95th, and 97th. These are published separately for boys and girls because growth trajectories differ by sex throughout infancy.
Percentile = % of WHO reference babies at the same age and sex that your baby's measurement exceeds
A baby at the 60th percentile for weight at 6 months weighs more than 60 out of 100 healthy 6-month-old boys (or girls, depending on sex) in the WHO reference group. A baby at the 50th percentile is exactly at the median.
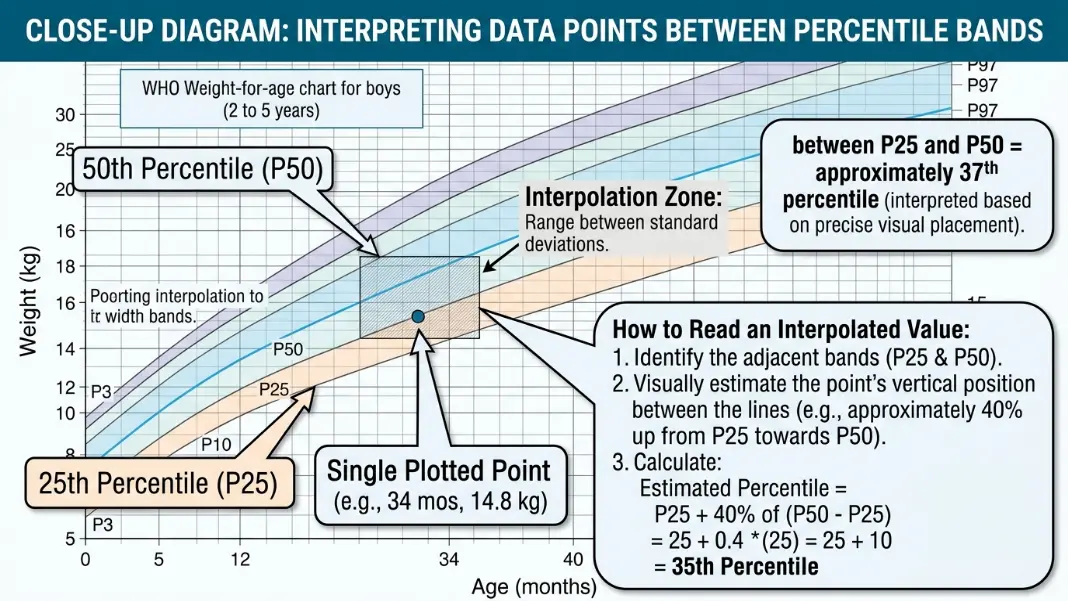
How percentile is estimated between published levels:
The published tables give reference weights at each whole month. When a baby is 3.5 months old, the reference values are linearly interpolated between the 3-month and 4-month entries. When a baby's weight falls between two published percentile levels, the exact percentile is estimated by linear interpolation within that band. For example, a weight falling halfway between the 25th and 50th percentile reference values maps to approximately the 37th percentile. The result is an estimate, not a clinical measurement, but accurate enough for consistent trend tracking.
What Percentile Is My Baby: Reading the WHO Chart Correctly
A WHO growth chart for weight-for-age shows 9 curved lines rising from left to right across birth to 24 months. Each line is a percentile level. Your baby is a single plotted point. The lines above and below that point identify the percentile band.
Most growth charts printed for use in pediatric offices show 7 lines (5th, 10th, 25th, 50th, 75th, 90th, 95th). The full WHO standard includes the 3rd and 97th as well. Knowing which version is on the wall matters. A point plotted visually near the bottom line on a chart starting at the 5th percentile reads differently from the same visual position on a chart that starts at the 3rd.
A baby's weight percentile and length percentile can differ by a significant margin, and that gap carries information. A baby at the 15th percentile for weight and the 70th percentile for length is long and lean, which is a very different picture from a baby at the 15th for both. The Baby Weight Percentile Chart by Age covers the full WHO reference values, month by month, for boys and girls at all 9 percentile levels.
Approximate WHO reference values at the 50th percentile for boys (the median):
These are the median measurements from birth to 24 months, giving a reference point for comparison.
| Age | Weight (50th) | Length (50th) |
|---|---|---|
| Birth | 3.3 kg (7.3 lb) | 50.0 cm (19.7 in) |
| 3 months | 6.0 kg (13.2 lb) | 61.0 cm (24.0 in) |
| 6 months | 7.9 kg (17.4 lb) | 67.6 cm (26.6 in) |
| 12 months | 9.6 kg (21.2 lb) | 75.7 cm (29.8 in) |
| 18 months | 10.9 kg (24.0 lb) | 82.3 cm (32.4 in) |
| 24 months | 12.2 kg (26.9 lb) | 87.8 cm (34.6 in) |
A 3-month-old boy weighing 5.4 kg is below the median. That places him somewhere in the 15th to 20th percentile band for his age. On its own, that reading tells a pediatrician almost nothing. The readings at 1 month and 6 months together tell them something meaningful.
What Baby Percentile Numbers Actually Tell You About Growth
Baby percentile describes where your baby sits on a population distribution at a single point in time. It does not describe whether your baby is healthy, adequately nourished, or on an optimal growth path. Two babies at the same percentile can be in completely different situations. Two babies at very different percentiles can both be growing perfectly normally.
The most practical thing to understand: normal is a wide range. The 5th to 95th percentile is the clinically accepted healthy zone for infant weight and length. A baby who has tracked consistently at the 8th percentile since birth is growing in a completely healthy pattern for their size. A baby who drops from the 75th to the 25th across two or three visits raises a very different question, even though both readings fall within the technical normal range.
Two questions matter more than the percentile number itself:
- Is this reading consistent with the pattern from recent visits, or has it shifted significantly?
- Are weight and length percentiles reasonably aligned, or is there a large gap between them?
Pediatricians track both. A large gap between weight and length percentiles, particularly low weight with normal length, is one indicator of inadequate intake or growth faltering. High weight with normal length can indicate overfeeding or a metabolic consideration worth monitoring.
The percentile is an input. The trend and the ratio are what clinicians actually use to assess whether growth is on track.
A note on prenatal percentiles:
If your baby had an estimated fetal weight percentile during pregnancy, that number was calculated differently, using ultrasound estimates and a separate fetal reference population. Fetal percentile and postnatal percentile are not directly comparable. A baby who reads "42nd percentile" on the 32-week ultrasound and arrives at the 58th percentile on the postnatal WHO chart has not changed position; the reference populations and measurement methods simply differ. The Baby Percentile During Pregnancy guide covers how ultrasound percentiles are calculated and how fetal estimates relate to birth weight.
Which Range Is Normal: The 3rd, 5th, and 97th Percentile Thresholds
The WHO uses the 3rd and 97th percentiles as its outer reference limits in growth monitoring. Below the 3rd or above the 97th is defined as outside the typical reference range, but that classification is not a diagnosis. It is a threshold that signals the measurement is statistically unusual for the reference population and warrants clinical attention.
The American Academy of Pediatrics and the CDC use the 5th to 95th as the normal range in routine pediatric growth assessment. The 5th percentile is the typical lower threshold below which monitoring frequency may increase.
What each zone means in clinical monitoring:
These thresholds mark where clinical attention increases, not where health ends.
| Percentile Zone | Clinical Significance |
|---|---|
| Below 3rd | Outside WHO reference range; evaluate for underlying cause |
| 3rd to 5th | Low normal; monitor for consistent tracking vs. downward trend |
| 5th to 95th | Normal range; consistent tracking across visits is the goal |
| 95th to 97th | High normal; monitor for accelerating trajectory |
| Above 97th | Outside WHO reference range; evaluate for underlying cause |
A single reading below the 5th percentile is not automatically alarming. A baby who was at the 20th at 2 months and measured at the 4th at 4 months has both crossed a threshold and shown a trend. That combination is more meaningful than either data point in isolation.
Breastfed babies and the WHO chart:
The WHO reference population was predominantly breastfed, which makes the WHO standard the more appropriate chart specifically for breastfed infants. Breastfed babies typically show slower weight gain after 3 to 4 months compared to formula-fed babies. On older CDC charts, which incorporated both feeding patterns and older data, this natural breastfed slowdown can look like a significant drop. On the WHO standard, the same pattern appears as expected stable tracking. If your breastfed baby's weight appears to drop sharply on one chart type, compare against the WHO version before concluding there is a problem.
Tracking Baby Percentile Across Visits: When to Watch and When to Wait
Most parents leave a well-child visit focused on the number they heard. Most pediatricians leave focused on whether that number moved.
A baby whose weight percentile has been stable between the 20th and 25th across five visits is growing exactly as expected. A baby who was at the 75th at 2 months, the 60th at 4 months, and the 45th at 6 months is trending downward in a way that warrants a conversation, even though all three readings fall within the normal range.
The useful clinical rule: dropping two major percentile lines across multiple visits is the pattern most associated with growth faltering. Major percentile lines are the 3rd, 10th, 25th, 50th, 75th, 90th, and 97th. Moving from between the 25th and 50th lines to between the 10th and 25th is one major line crossed downward. Moving from the 75th line to near the 25th is two.
Normal reasons percentile shifts:
Several patterns produce percentile movement that does not indicate any underlying problem.
Babies born to small parents but with higher birth weight tend to drift toward lower percentiles in the first 3 to 6 months as their genetic growth trajectory asserts itself. This regression toward parental size is normal and expected. A baby whose parents both tracked at lower percentiles in childhood settling into the 12th percentile by 6 months is following their genetic program.
Illness, teething, and feeding disruptions reduce intake for days or weeks at a time. A measurement taken during or just after a respiratory illness may show a temporary dip that resolves completely at the following visit. One data point under those conditions tells you almost nothing.
Growth spurts followed by relative plateaus create jagged-looking trajectories. Some babies gain weight rapidly in a 2 to 3 week window, then slow for the next month. The chart looks uneven. The underlying growth curve is smooth.
For more on what the extreme values in the distribution mean clinically, including the 99th and 3rd percentile readings, the 99th Percentile Baby: What High and Low Percentiles Mean guide covers both ends of the chart in detail.
![]()
Baby percentile shows how your baby's weight or length compares to a reference group of babies the same age and sex. A baby at the 40th percentile for weight weighs more than 40% of babies in the WHO reference population at that age. Percentiles are not grades. A baby at the 15th percentile can be growing as healthily as one at the 75th. The number becomes clinically significant when it shifts sharply across multiple visits, not from a single reading.
The 5th to 95th percentile is the normal range used in clinical practice by the CDC and American Academy of Pediatrics. The WHO uses the 3rd to 97th as its outer reference bounds. Any percentile within those ranges is consistent with healthy growth, provided it is stable across visits. A baby consistently at the 8th percentile is not a concern. A baby who drops from the 70th to the 8th across two or three visits is, regardless of where they land.
Baby percentile is calculated by comparing your baby's weight or length to WHO reference values for the same age and sex. The WHO publishes reference values at 9 percentile levels (3rd through 97th) for each month from birth to 24 months, separately for boys and girls. If your baby's measurement falls between two published percentile bands, the exact percentile is estimated by linear interpolation within that band. The Baby Percentile Calculator handles the interpolation automatically and displays the result with a full reference table.
The 50th percentile is the median: your baby's measurement exceeds exactly half of babies the same age and sex in the WHO reference population. It is the midpoint of the distribution, not the healthiest or best outcome. A baby consistently at the 20th percentile is growing just as healthily as one at the 50th, provided their trajectory is stable. The 50th has no special clinical significance; it is simply the reference midpoint.
Enter your baby's age in months, sex, and weight or length into the Baby Percentile Calculator at the top of the page. It compares those inputs to WHO reference data and returns the percentile estimate alongside a reference table. For the most accurate result, use weight measured on a calibrated infant scale in a medical setting and length measured lying flat on a flat surface. Home scale measurements and against-the-wall length readings can introduce enough error to shift the apparent percentile by 5 to 10 points.
A consistently low percentile is not cause for concern by itself. Babies from smaller parents naturally track at lower percentiles throughout infancy without any growth problem. The pattern that warrants attention is a significant downward shift across multiple visits, particularly crossing two major percentile lines. A single low reading after an illness or a week of reduced feeding rarely indicates anything significant on its own. Bring the growth card to every well-child visit and let the trend across 3 or more measurements guide the conversation with your pediatrician.
Written by
Hassaan Rasheed
Web Developer & Content Researcher
Hassaan builds calculators and writes research-backed guides on finance, math, payroll, and construction topics. Every number in his articles is sourced from official data and worked through by hand.
View LinkedIn Profile