99th Percentile Baby: What High and Low Percentiles Mean (2026)
99th percentile means heavier than 99% of the same-age reference distribution. What high and low weight-for-age percentiles do—and do not—show.
Baby Percentile Calculator: Weight and Length
WHO Child Growth Standards, birth to 24 completed months.
On this WHO weight-for-age chart, this measurement is heavier than approximately 50% of the reference population with the same age and sex. A single percentile is not a diagnosis; clinicians assess repeated measurements and the full growth pattern.
| 3rd | 5th | 10th | 25th | 50th | 75th | 90th | 95th | 97th |
|---|---|---|---|---|---|---|---|---|
| 5.09 kg | 5.24 kg | 5.48 kg | 5.89 kg | 6.38 kg | 6.90 kg | 7.40 kg | 7.71 kg | 7.92 kg |
Sources: WHO weight-for-age and length/height-for-age standards. Calculated from the published monthly LMS parameters for completed whole months. Weight-for-age alone does not classify underweight or overweight. Reference tool only — not medical advice.
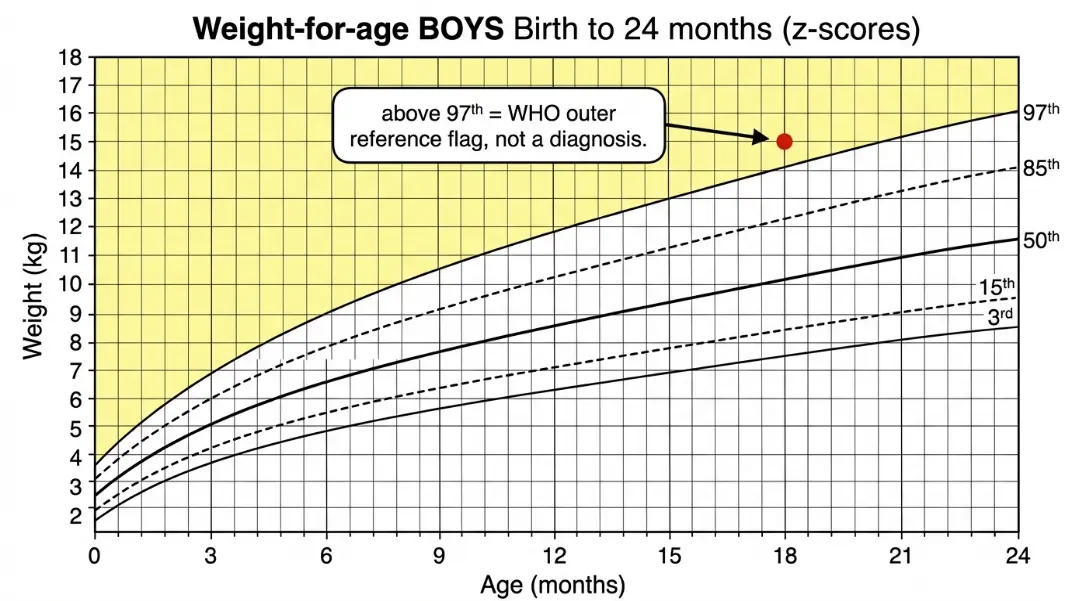
When the nurse says your baby is in the 99th percentile, most parents hear one of two things: "great job" or quiet worry about whether their baby is too large. For weight-for-age, P99 means the measurement plots above 99% of the modeled distribution for babies of the same age and sex. It does not, by itself, diagnose overweight or a health problem.
Use the calculator above to check the weight-for-age or length-for-age result before reading anything into a single number.
What it means in practice depends on measurement quality, the earlier trajectory, weight relative to length, feeding, development, and health history. The calculator uses the monthly LMS parameters from WHO's official weight-for-age and length/height-for-age standards.
For a broader explanation of the ranking itself, see what the 99th percentile means before applying it to any one measurement.
What the 99th and 98th Percentile Mean for a Baby's Weight#
A baby at the 99th percentile for weight plots above 99% of the sex-specific weight-for-age reference distribution. At 6 months, the WHO boys' P97 value is about 9.7 kg (21.4 lb), while P99 is about 10.2 kg (22.5 lb).
P97 is one of the upper centile lines available in WHO tables. Plotting above it is statistically uncommon, but P97 is not a universal diagnostic cutoff and a single reading above it does not establish a problem.
When a high percentile is not a concern:
Family size can help explain a consistently high measurement, but it is only one part of the assessment. Clinicians also review the measurement technique, trajectory, feeding, and weight-for-length.
Feeding method alone cannot determine whether a high percentile is appropriate for an individual baby. A clinician can review feeding cues, milk or formula preparation, intake, and growth history without treating P98 as a diagnosis.
Some parents notice that a high postnatal percentile follows a high fetal percentile. The two are not directly comparable: fetal weight was estimated from ultrasound and evaluated on a fetal curve, while postnatal weight is measured and plotted on a different standard. The Baby Percentile During Pregnancy guide explains that distinction.
When a high percentile warrants a closer look:
A rapid upward crossing of percentile lines is more clinically significant than a consistently high reading. A baby who was at the 50th at birth and has risen to the 97th by 4 months, gaining weight at a rate noticeably faster than the reference curves, is showing an accelerating trajectory. The change is what matters, not just the number.
The Baby Weight Percentile Chart by Age provides selected WHO reference values and explains how the calculator derives a continuous percentile from the official monthly LMS data.
What the 3rd Percentile Means and When It Becomes a Concern#
A baby at P3 for weight plots above about 3% of the modeled same-age, same-sex weight-for-age distribution. Values below P3 and above P97 occupy uncommon tails of that distribution; neither position is a diagnosis.
The critical distinction is whether a baby at the 3rd percentile has always been at the 3rd or arrived there recently.
Constitutionally small babies:
A baby who tracks near a low centile may be constitutionally small, but the chart cannot prove that explanation. Clinicians check serial measurements, weight-for-length, feeding, development, symptoms, examination, and family context before drawing a conclusion.
Babies who fall to the 3rd:
A baby plotted at P35 and later at P3 has changed trajectory substantially. That pattern should prompt confirmation of the measurements and clinical review; the chart alone cannot show whether the cause is feeding, illness, normal catch-down growth, or something else.
Growth faltering is assessed from a pattern plus clinical context, not diagnosed solely from this example or from being below a fixed weight-for-age percentile.
The Difference Between High and Low Percentile in Clinical Practice#
High and low extreme percentile readings are evaluated on the same framework: the trajectory matters more than the absolute position.
This table shows questions a clinician may ask; it does not assign a cause from the percentile alone.
| Reading | What the chart shows | Context to review |
|---|---|---|
| Consistently above P95 | Persistently high weight-for-age position | Weight-for-length, family size, feeding, development |
| New reading above P97 | An uncommon upper-tail value | Measurement accuracy and earlier trajectory |
| Consistently below P5 | Persistently low weight-for-age position | Weight-for-length, intake, development, family context |
| New reading below P3 | An uncommon lower-tail value | Repeat measurement, feeding, illness, hydration, symptoms |
| Large downward shift | A changed plotted trajectory | Timing, scale/technique, intake, illness, development |
| Large upward shift | A changed plotted trajectory | Timing, scale/technique, feeding, length and weight-for-length |
Crossing two major centile spaces is used as a screening flag in some growth-faltering guidance, but it is not a universal diagnosis. The chart and guideline in use determine which spaces count.
What the 95th percentile means compared to the 99th:
P95 and P99 are simply different positions in the upper tail: 5% of reference values plot above P95 and 1% above P99. Neither is a universal upper boundary for health, and weight-for-age alone cannot classify overweight.
A P99 value is statistically uncommon and is best interpreted with the earlier trajectory and weight-for-length. Family size may be relevant, but it should not end the assessment automatically.
How High Percentile and Low Percentile Relate to Length-for-Age#
Weight percentile in isolation tells only part of the story. Length percentile is the other variable, and the relationship between the two matters clinically.
A baby's weight-for-age and length-for-age positions provide context, but subtracting those percentile numbers does not calculate proportionality. The WHO weight-for-length standard directly compares the baby's weight with recumbent length and can produce a different result from either age-based percentile.
For children under 24 months, clinicians commonly use weight-for-length alongside the individual age-based charts. From age 2, BMI-for-age is generally used instead.
The What Does Baby Percentile Mean guide explains how weight and length percentiles are calculated separately and why the two measurements are always tracked together.
What to Expect at Visits When Percentile Is at an Extreme#
A clinician may review the following areas when a baby's measurement plots near an extreme centile. The exact response depends on age, symptoms, trajectory, and examination.
At a very high percentile visit, your pediatrician is likely to:
- Review the growth chart from prior visits to confirm the trajectory
- Ask about family history: parent heights, build, birth weights of siblings
- Ask about feeding method, frequency, and whether feedings are self-regulated
- If breastfed, assess whether feeds are to satiety or on a rigid schedule
- If formula fed, check concentration and daily volume
- Assess length percentile to see whether weight and length are proportionate
A weight-for-length result, feeding assessment, and prior measurements help determine whether any follow-up is needed; the weight-for-age percentile alone cannot decide that.
At a very low percentile visit, your pediatrician is likely to:
- Review whether the current reading is consistent with prior visits or a new drop
- Ask about feeding: how often, how much, signs of hunger or satiety
- Ask about wet and dirty diaper frequency as an output measure of intake
- Check length percentile to assess weight-for-length ratio
- Decide whether and when a repeat measurement or further assessment is needed
If a downward trend across multiple visits is confirmed, the next steps depend on the clinical picture: feeding assessment with a lactation consultant or feeding therapist, dietary changes, or referral for further evaluation of absorption and metabolism.
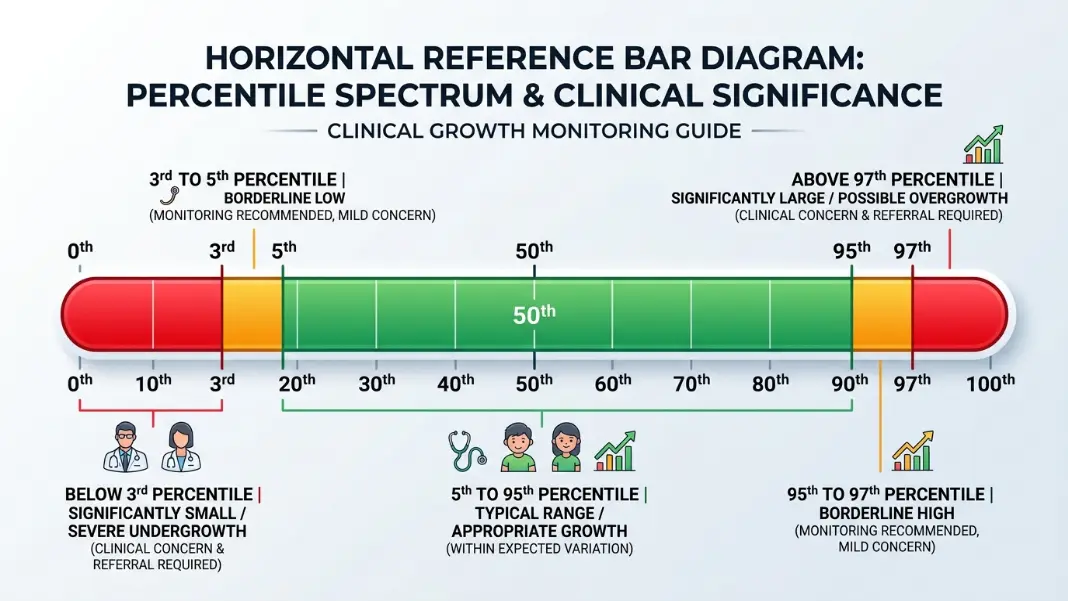
A baby at P99 for weight plots above 99% of the modeled WHO weight-for-age distribution for the same age and sex. It is an uncommon statistical position, not a diagnosis. Measurement quality, prior trajectory, weight-for-length, feeding, development, symptoms, and family context determine what it means clinically.
No conclusion about overweight can be made from weight-for-age P99 alone. For children under 2, clinicians use the separate weight-for-length standard, plus the growth trajectory, feeding, development, health history, and examination.
A baby at P3 for weight plots above about 3% of the same-age, same-sex weight-for-age reference distribution. That is a statistical description. A new shift from P40 to P3 is different from a stable low trajectory, but both should be interpreted with accurate measurements, weight-for-length, feeding, development, symptoms, and clinical history.
P98 means the weight plots above 98% of the modeled weight-for-age distribution for the same age and sex. It is above the P97 line shown in some WHO tables, but there is no universal rule that P98 must be managed in one particular way.
Ask the baby's clinician about a substantial shift from the earlier trajectory, weight loss, feeding difficulty, fewer wet diapers, persistent symptoms, or any concern about growth or development. An isolated result may reflect measurement error, but symptoms or feeding concerns should not be dismissed while waiting for another point.
P95 means 5% of reference values plot higher; at P99, 1% plot higher. Neither is a universal health boundary, and neither diagnoses overweight from weight-for-age alone. Weight-for-length, the trajectory, feeding, development, symptoms, and family context provide the clinical meaning.
Written by
Hassaan Rasheed
Web Developer & Content Researcher
Hassaan builds calculators and writes source-linked guides across the site's subject areas. Calculator methods and reference data are documented in each guide so readers can verify the underlying sources.
About the author and methods