Baby Percentile Calculator 2026
How to Calculate Baby Weight and Length Percentile
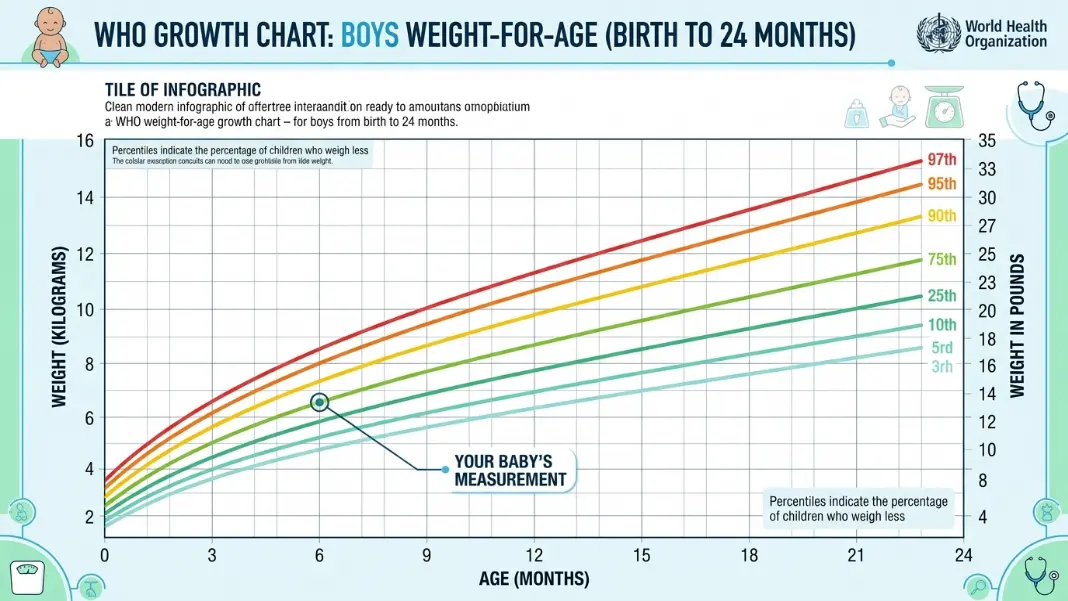
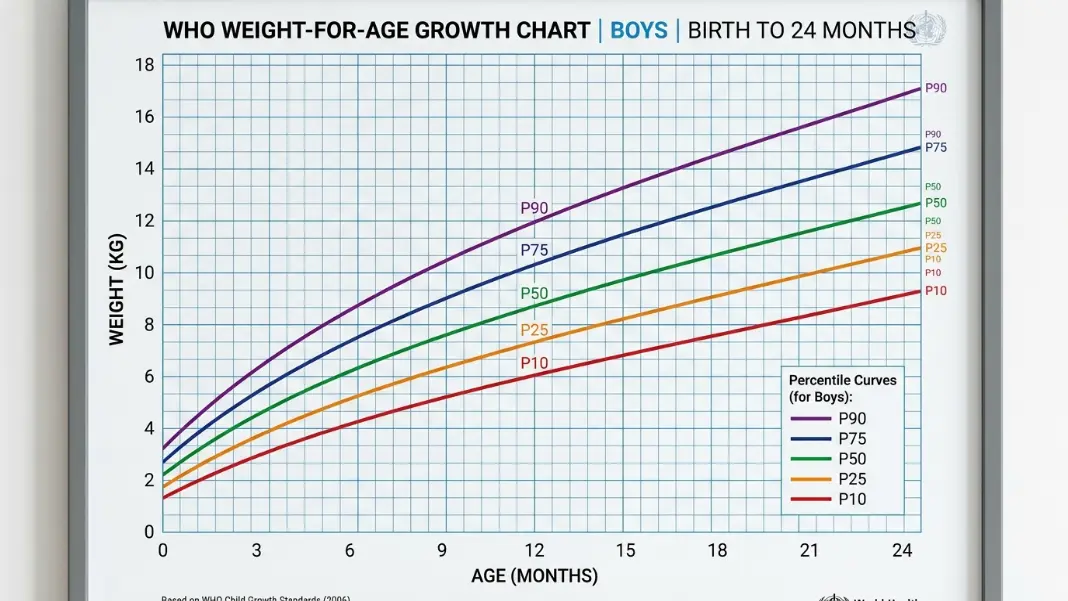
The WHO Child Growth Standards (2006) provide reference values at nine percentile thresholds for each month from birth to 24 months, separated by sex. Both weight and length follow the same four-step process:
For the most accurate result, use exact age in months rather than rounding. The Chronological Age Calculator converts a birth date to exact months and days, which you can enter as a decimal (for example, 6.5 months for a baby 6 months and 2 weeks old).
Baby Boy and Baby Girl Percentile: Why Sex-Specific Charts Matter
Boys and girls follow different weight and length trajectories from birth. At every age from 0 to 24 months, boys have higher weight and length thresholds at each percentile level than girls of the same age. The weight gap is small at birth (roughly 0.2 kg) and grows to about 0.7 kg by 12 months. The length gap is roughly 1 cm at birth and widens slightly through 24 months.
Using a sex-matched chart avoids two common errors: classifying a healthy baby boy as overweight because his weight is compared to female norms, or flagging a normal baby girl as underweight because her weight is compared to male thresholds. The WHO publishes separate tables for boys and girls, and this calculator applies the correct table automatically based on your selection.
This calculator covers weight-for-age and length-for-age for ages 0–24 months. For older children (2–20 years), the CDC growth chart is recommended. New mothers tracking postpartum recovery alongside infant growth monitoring can also use the Period Calculator to monitor cycle return after delivery.
Breastfed Baby Percentile: WHO vs CDC Growth Standards
The WHO chart used in this calculator was built from a multicentre study of healthy, breastfed infants in six countries. Because it reflects optimal growth conditions, it is considered prescriptive: it shows how babies should grow, not just how they do grow in a given population.
The older CDC 2000 growth chart was based on a U.S. population with lower breastfeeding rates. Breastfed babies typically gain weight faster than formula-fed babies in the first 3 months, then grow more slowly from months 3 to 12. On CDC charts, breastfed babies often appear to cross percentile lines downward during this period, which has caused unnecessary concern. The WHO chart accurately captures this pattern and shows it as normal.
The CDC recommends the WHO chart for all U.S. children under 2 years regardless of feeding method. Parents managing gestational diabetes postpartum can track blood glucose alongside infant growth using our A1C Calculator.
Frequently Asked Questions
Related Guides
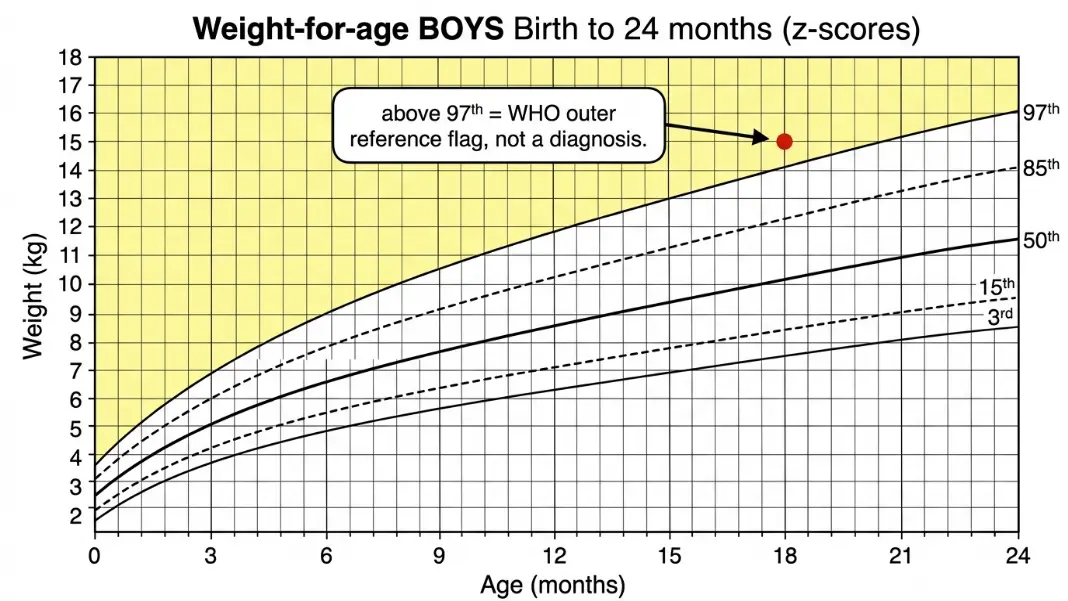
Percentile ranking matters less than trend. A baby consistently at the 10th percentile and growing steadily is healthier than one dropping from the 50th to the 10th across several visits. Track both weight and length together — a baby gaining weight but not length (or vice versa) tells a different story than one tracking consistently on both curves.