50th Percentile Baby: Average Weight and Length by Month, WHO Chart (2026)
The 50th percentile is the WHO median reference value for age and sex. See monthly weight and length tables for boys and girls and learn how to read a trajectory.
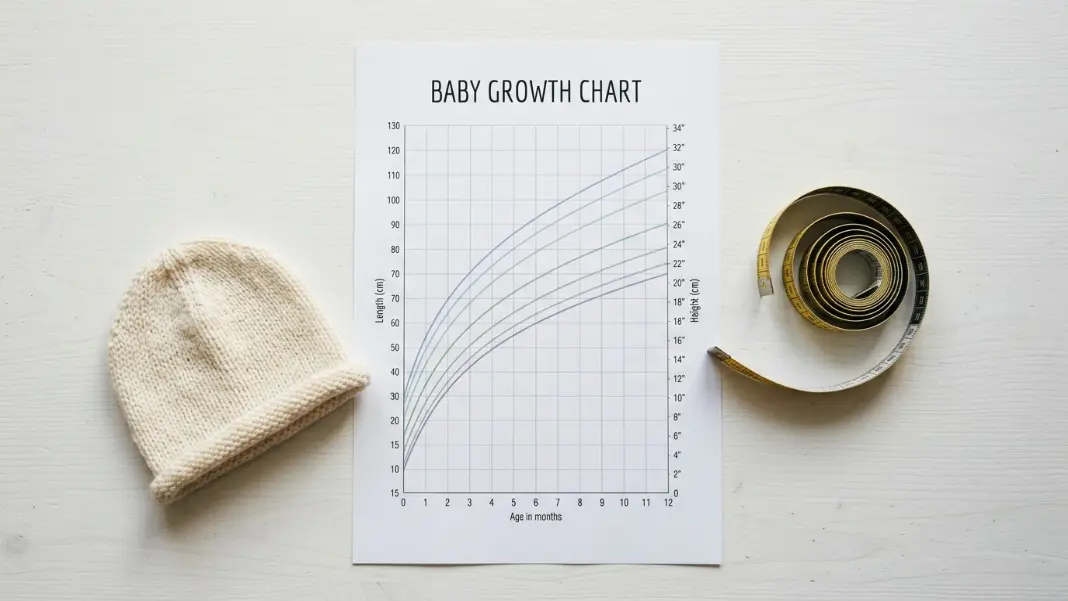
It is easy to treat the 50th percentile as a target, but that is not what the number means.
The 50th percentile is the median measurement in the WHO reference distribution for a given age and sex: half of the reference distribution is above that value and half is below it. A measurement above or below the median does not, by itself, establish whether a child is healthy or unhealthy. Clinicians interpret accurate measurements over time alongside feeding, development, medical history, and other relevant information. The Baby Percentile Calculator calculates weight-for-age or length-for-age against the WHO monthly standards.
What the 50th Percentile Actually Measures#
The WHO Child Growth Standards were developed from the Multicentre Growth Reference Study, which collected standardized measurements from selected children in six countries. The 50th percentile is the median value in the resulting age- and sex-specific distribution.
“Median” and “arithmetic mean” are different statistical concepts. The median is the middle ranked value and does not require the measurements to follow a normal distribution. The WHO curves use age-specific L, M, and S parameters; the M parameter is the median shown in the tables below.
A percentile describes relative position for one measurement. For example, weight-for-age does not show whether weight is proportional to length and does not diagnose underweight, overweight, or another condition. Likewise, being between the 3rd and 97th percentiles is not a guarantee of health, and being outside those centile lines is not a diagnosis.
The chart is a reference distribution, not a scorecard.
50th Percentile Baby Weight by Month: WHO Reference Tables#
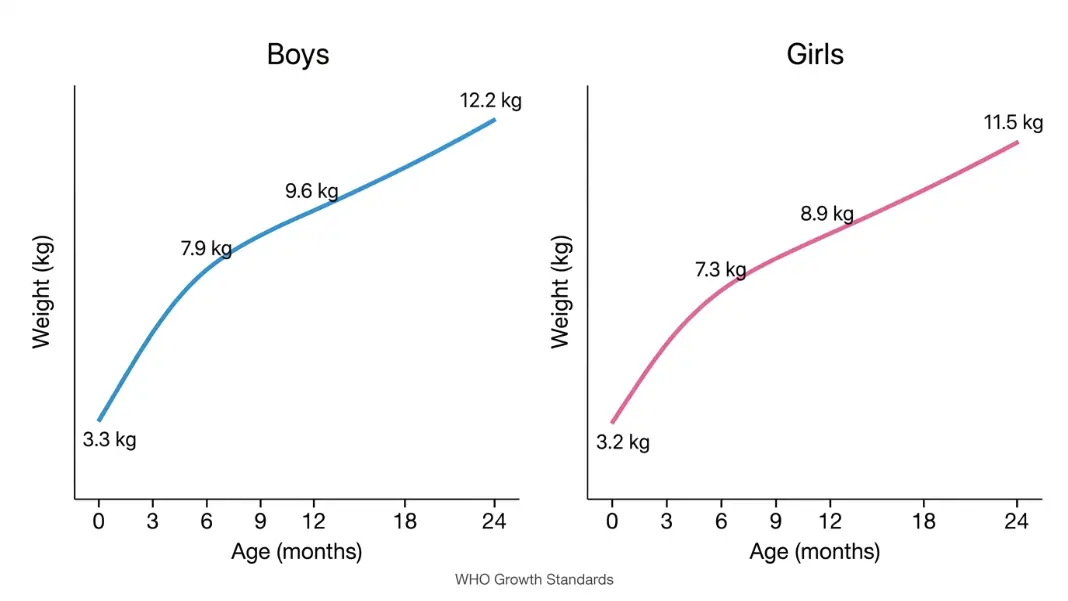
The values below are the M (median) values from the official WHO weight-for-age standards, rounded to two decimal places. Pound conversions are rounded to one decimal place.
Boys: 50th percentile weight by month
| Age | 50th Percentile Weight |
|---|---|
| Birth | 3.35 kg (7.4 lb) |
| 1 month | 4.47 kg (9.9 lb) |
| 2 months | 5.57 kg (12.3 lb) |
| 3 months | 6.38 kg (14.1 lb) |
| 4 months | 7.00 kg (15.4 lb) |
| 5 months | 7.51 kg (16.6 lb) |
| 6 months | 7.93 kg (17.5 lb) |
| 9 months | 8.90 kg (19.6 lb) |
| 12 months | 9.65 kg (21.3 lb) |
| 18 months | 10.94 kg (24.1 lb) |
| 24 months | 12.15 kg (26.8 lb) |
Girls: 50th percentile weight by month
| Age | 50th Percentile Weight |
|---|---|
| Birth | 3.23 kg (7.1 lb) |
| 1 month | 4.19 kg (9.2 lb) |
| 2 months | 5.13 kg (11.3 lb) |
| 3 months | 5.85 kg (12.9 lb) |
| 4 months | 6.42 kg (14.2 lb) |
| 5 months | 6.90 kg (15.2 lb) |
| 6 months | 7.30 kg (16.1 lb) |
| 9 months | 8.23 kg (18.1 lb) |
| 12 months | 8.95 kg (19.7 lb) |
| 18 months | 10.23 kg (22.6 lb) |
| 24 months | 11.48 kg (25.3 lb) |
The Baby Weight Percentile Chart by Age shows additional centile values derived from the same monthly WHO LMS data.
50th Percentile Baby Length by Month: WHO Reference Tables#
These recumbent-length medians come from the official WHO length/height-for-age standards. The birth-to-24-month table uses recumbent length, not standing height.
Boys: 50th percentile length by month
| Age | 50th Percentile Length |
|---|---|
| Birth | 49.9 cm (19.6 in) |
| 1 month | 54.7 cm (21.5 in) |
| 2 months | 58.4 cm (23.0 in) |
| 3 months | 61.4 cm (24.2 in) |
| 4 months | 63.9 cm (25.2 in) |
| 6 months | 67.6 cm (26.6 in) |
| 9 months | 72.0 cm (28.3 in) |
| 12 months | 75.7 cm (29.8 in) |
| 18 months | 82.3 cm (32.4 in) |
| 24 months | 87.8 cm (34.6 in) |
Girls: 50th percentile length by month
| Age | 50th Percentile Length |
|---|---|
| Birth | 49.1 cm (19.3 in) |
| 1 month | 53.7 cm (21.1 in) |
| 2 months | 57.1 cm (22.5 in) |
| 3 months | 59.8 cm (23.5 in) |
| 4 months | 62.1 cm (24.4 in) |
| 6 months | 65.7 cm (25.9 in) |
| 9 months | 70.1 cm (27.6 in) |
| 12 months | 74.0 cm (29.1 in) |
| 18 months | 80.7 cm (31.8 in) |
| 24 months | 86.4 cm (34.0 in) |
Feeding Method and Which Growth Chart to Use#
Feeding is part of the WHO standard’s methodology, but it does not provide a rule for predicting an individual child’s percentile. The study population was predominantly breastfed for at least four months and continued breastfeeding to at least 12 months. The CDC explains this background in its Breastfeeding and Infant Growth Standards guidance.
For U.S. children, the CDC recommends the WHO standards from birth to age 2 regardless of feeding method; see What Growth Charts Are Recommended?. A child does not need to sit at a particular percentile because of breast- or formula-feeding, and feeding method alone should not be used to explain a high, low, or changing measurement. A clinician can interpret feeding history together with serial measurements and the rest of the child’s assessment.
When Your Baby Tracks Away From the 50th Percentile#
Percentile position can change between visits. A change may reflect actual growth, age calculation, different equipment, clothing, feeding before a weigh-in, recumbent-length technique, or ordinary measurement variability. The chart alone cannot identify the cause.
There is no universal rule that one crossed centile line is harmless while two crossed lines prove a problem. The time interval, the size and direction of the change, repeated weight and length measurements, and the child’s clinical context all matter. If a measurement changes substantially, seems inconsistent with prior measurements, or accompanies concerns about feeding, illness, or development, check the entry and discuss the pattern with a qualified health professional.
The 3rd Percentile Baby guide explains how to read a low reference position without treating a centile cutoff as a diagnosis.
Growth Velocity and Why the Direction Matters More Than the Number#
Growth velocity is the change in a measurement over a defined interval. Two children can have the same current percentile but different prior measurements, which is why a single point cannot describe a trajectory.
Velocity also depends on reliable dates and comparable measurements. A short interval can magnify ordinary measurement error, while a longer series can make the pattern clearer. Health professionals can plot serial weight, recumbent length, and other relevant measures on the appropriate chart and decide whether additional evaluation is needed. The 50th percentile itself remains a reference midpoint, not a goal.
For a full explanation of what all the percentile lines represent and how to read a growth chart at each visit, the What Does Baby Percentile Mean post walks through the WHO reference system from the 3rd to the 97th percentile.
The 50th percentile is the median of the WHO reference distribution for a measurement at the same age and sex. Half of that reference distribution is above the value and half is below it. It is not a target, and no percentile by itself establishes whether a child is healthy.
The WHO weight-for-age median at birth is 3.35 kg (7.4 lb) for boys and 3.23 kg (7.1 lb) for girls after rounding. These are reference medians, not cutoffs for an individual newborn. A clinician interprets birth weight with gestational age, measurement conditions, and the newborn's medical context.
At 6 completed months, the WHO weight-for-age median is 7.93 kg (17.5 lb) for boys and 7.30 kg (16.1 lb) for girls after rounding. These values describe the middle of the reference distribution; they are not a required weight or a diagnostic range.
A percentile change cannot be interpreted from the number of chart lines crossed alone. Confirm the age and measurement, then consider the interval, repeated weight and length values, feeding, illness, development, and medical history. Discuss a substantial or persistent change, or any related concern, with a qualified health professional.
The WHO standards were developed from a study population that was predominantly breastfed for at least four months. In the United States, the CDC recommends using the WHO charts from birth to age 2 for both breastfed and formula-fed children. Feeding method is clinical context, but it does not predict a required percentile for an individual child.
At 12 completed months, the WHO length-for-age median is 75.7 cm (29.8 inches) for boys and 74.0 cm (29.1 inches) for girls after rounding. The birth-to-2-year WHO table uses recumbent length. Positioning and measurement technique can affect the plotted percentile, so comparable measurements matter when assessing a trajectory.
Primary Sources#
Written by
Hassaan Rasheed
Web Developer & Content Researcher
Hassaan builds calculators and writes source-linked guides across the site's subject areas. Calculator methods and reference data are documented in each guide so readers can verify the underlying sources.
About the author and methods