IRR in Google Sheets: IRR and XIRR Formula Walkthrough (2026)
How to calculate IRR and XIRR in Google Sheets. Exact formula, worked example, common errors fixed, and when to use XIRR over IRR for irregular cash flow dates.
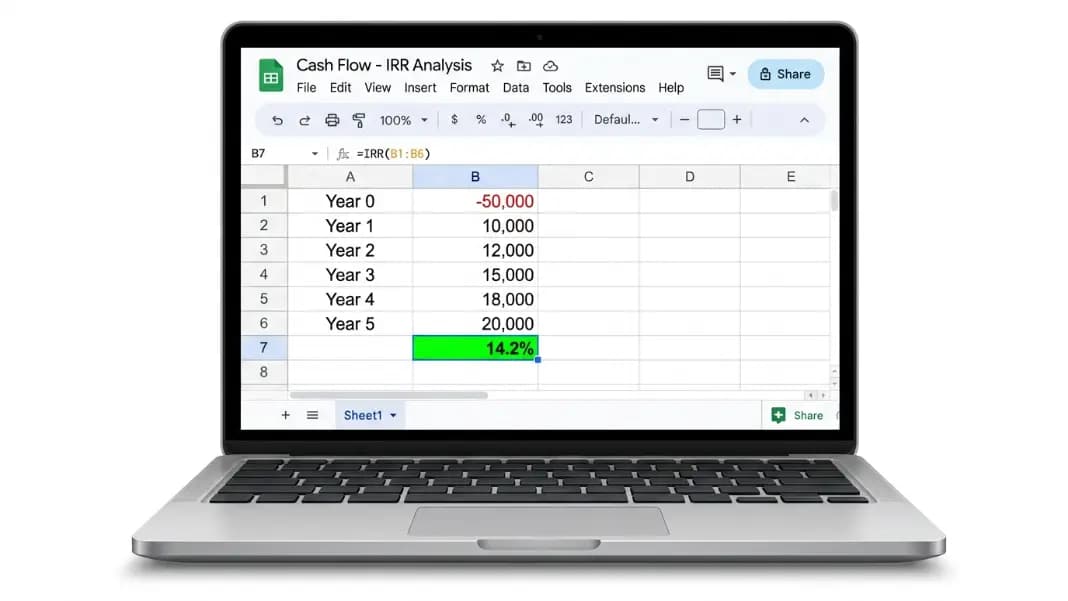
Google Sheets has both IRR and XIRR built in. Which one you should use depends entirely on one question: do your cash flows happen at exactly equal time intervals?
If yes, IRR works. If no (and most real investments do not have perfectly spaced cash flows), XIRR gives you the accurate answer. The IRR Calculator handles either case if you want a quick result, but knowing how to run it in a spreadsheet lets you model scenarios, update numbers, and build the calculation into a larger analysis.
IRR vs XIRR in Google Sheets: Which One You Actually Need
Both functions calculate internal rate of return. The difference is in what they assume about timing.
IRR assumes each cash flow in your list is separated by exactly one period. That period could be a month, a quarter, or a year, but they must all be equal. If you model a 5-year investment with one cash flow per year, IRR is appropriate.
XIRR takes explicit dates for each cash flow. It calculates the actual annualized return based on the real number of days between each cash flow. This matters whenever your investment does not fit a clean annual or monthly calendar.
For most real-world uses, XIRR is the right function:
- Real estate purchase on March 15 with rental income collected on irregular dates
- Private equity deal with capital calls and distributions that do not land on anniversaries
- Business investment with quarterly revenue sharing that does not line up with the fiscal year
If you are modeling a textbook annuity with exactly annual cash flows, IRR is fine. For anything with actual calendar dates, use XIRR.
How to Enter the IRR Formula in Google Sheets
The IRR function takes two arguments:
=IRR(values, [guess])
- values: a range of cells containing your cash flows. The first cash flow must be negative (your initial investment). At least one later value must be positive.
- guess: optional. A starting estimate for the rate. Default is 0.1 (10%). Only needed if the function returns an error.
Worked example: You invest $50,000 in a rental property and receive net cash flows over 5 years before selling.
Set up your spreadsheet:
| Row | Cash Flow |
|---|---|
| Year 0 | -50,000 |
| Year 1 | 4,200 |
| Year 2 | 4,500 |
| Year 3 | 4,800 |
| Year 4 | 5,000 |
| Year 5 | 63,000 (including sale proceeds) |
Enter these values in cells B1 through B6. In an empty cell, type:
=IRR(B1:B6)
Google Sheets returns approximately 14.2% as the annualized IRR for this series.
To display it as a percentage, format the cell as percentage in Format > Number > Percent.
Using XIRR for Irregular Cash Flow Dates
The XIRR function takes three arguments:
=XIRR(values, dates, [guess])
- values: cash flows, same sign convention as IRR (negative for outflows, positive for inflows)
- dates: the actual calendar date of each cash flow, in the same order as the values
- guess: optional, same as IRR
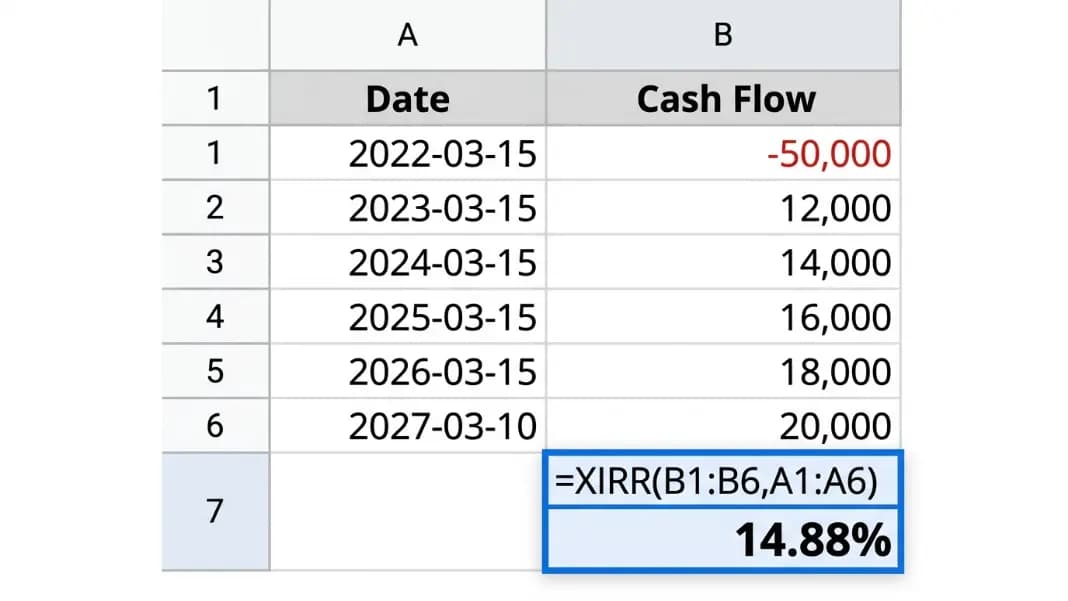
Worked example: Same rental property but with actual transaction dates.
| Row | Date | Cash Flow |
|---|---|---|
| Row 1 | 2022-03-15 | -50,000 |
| Row 2 | 2022-12-31 | 4,200 |
| Row 3 | 2023-12-31 | 4,500 |
| Row 4 | 2024-12-31 | 4,800 |
| Row 5 | 2025-12-31 | 5,000 |
| Row 6 | 2027-03-10 | 63,000 |
Enter dates in column A (formatted as dates) and cash flows in column B. In an empty cell:
=XIRR(B1:B6, A1:A6)
The result will differ slightly from the plain IRR result because the first cash flow is in March, not January, and the final cash flow is also mid-year. XIRR calculates based on the actual number of days between each event, expressed as a fraction of a 365-day year.
For this reason, XIRR almost always gives you a more defensible number to present to an investor or lender than IRR, even for investments that are mostly annual.
When Google Sheets Returns an IRR Error (and How to Fix It)
The two errors you will encounter most often are #NUM! and #DIV/0!.
#NUM! error is the most common. It means Google Sheets could not converge on a solution within the default 20 iterations. This happens in two situations:
- Your cash flows do not include at least one negative and one positive value. IRR requires an outflow and at least one inflow to calculate a return.
- The actual IRR of your investment is extreme (below -100% or above several hundred percent). The default guess of 10% may not be close enough for the solver to find the answer.
Fix for situation 1: review your cash flows and confirm the first value is negative (the initial investment).
Fix for situation 2: add a guess closer to the expected answer. If you suspect the IRR is around 40%, try:
=IRR(B1:B6, 0.4)
#DIV/0! error appears when you have only one value in your range or all values are zero. Add the missing cash flows before running the function.
For XIRR, an additional source of errors is date formatting. Google Sheets must recognize the values in your date column as actual date types, not text strings. If your dates look like "2024-03-15" but are stored as text, XIRR will return an error. Select the date column, go to Format > Number > Date to confirm they are formatted correctly.
The How to Calculate IRR in Excel post covers the same functions in Excel, including the MIRR function for modified IRR, which works identically in Google Sheets and handles reinvestment rate assumptions.
Google Sheets vs Excel: What Is Actually Different
The IRR and XIRR formulas in Google Sheets and Excel produce the same results for the same inputs. The syntax is identical. The underlying algorithm is the same Newton-Raphson iterative solver.
The practical differences are in the interface and a few edge cases:
Initial guess handling. Google Sheets tends to converge on solutions slightly more reliably than Excel for extreme IRR values without requiring an explicit guess. In practice, this difference rarely matters unless your cash flows are unusually structured.
Circular reference handling. If your spreadsheet has circular references (uncommon in a simple IRR model but possible in complex financial models), Google Sheets and Excel handle them differently. This is not something most users encounter.
Accessibility. Google Sheets is free and browser-based. For anyone building a shareable model with investors or partners who may not have Excel, a Google Sheets IRR model is easier to distribute without compatibility issues.
For investment benchmarks, the IRR vs NPV post explains when internal rate of return and net present value give you conflicting signals and which one to trust for capital allocation decisions.
Checking Your Result Against Benchmarks
A calculated IRR is only useful in context. The number itself does not tell you whether an investment is worth making. That judgment depends on your hurdle rate, asset class, and risk profile.
Typical IRR benchmarks by investment type give you a starting comparison:
| Investment Type | Target IRR Range |
|---|---|
| Core real estate (low risk) | 7-11% |
| Value-add real estate | 12-18% |
| Private equity (buyout) | 20-25% |
| Venture capital | 25-35%+ |
| S&P 500 (historical avg) | ~10% annualized |
An investment with an IRR of 14% might be excellent for a core real estate deal and underwhelming for a venture investment. Comparing against your required return (hurdle rate) tells you whether the deal clears the bar.
If your modeled IRR is significantly above these ranges, double-check your cash flow signs and make sure your terminal value (sale proceeds or residual value) is not overstated. A common error is entering the sale price rather than the net sale proceeds after transaction costs and remaining mortgage balance, which inflates the IRR.
The What Is a Good IRR post covers benchmarks in detail across asset classes and explains how debt financing affects the spread between project-level and equity-level IRR.
Enter your cash flows in a column with the initial investment as a negative number. In an empty cell, type =IRR(range) where range is your cash flow cells, for example =IRR(B1:B6). For investments with specific dates on each cash flow, use =XIRR(values, dates) instead, which calculates a more accurate annualized return based on the actual number of days between cash flows.
IRR assumes all cash flows occur at exactly equal intervals (one year, one quarter, etc.). XIRR takes explicit calendar dates for each cash flow and calculates the true annualized return based on actual days elapsed. For most real investments with imprecise timing, XIRR produces a more accurate result. The two functions return the same number only when every cash flow is exactly one year apart.
A #NUM! error means the solver could not find a solution. The two most common causes are: the cash flow range does not contain at least one negative and one positive value (IRR requires both an outflow and an inflow), or the actual IRR is extreme enough that the default 10% guess is too far away for the solver to converge. Fix by checking cash flow signs, or by adding a guess: =IRR(B1:B6, 0.3) to start the solver at 30%.
Yes. The XIRR function syntax and algorithm are identical in both applications: =XIRR(values, dates, [guess]). Both use the same Newton-Raphson iterative solver and a 365-day year basis. Results will match exactly for the same inputs. The only practical difference is that Google Sheets is browser-based and free, which makes it easier to share models without Excel license requirements.
The guess parameter gives the solver a starting point. IRR works by trying different rates until the net present value of your cash flows equals zero. Starting closer to the actual answer helps the solver converge. The default is 0.1 (10%). If your investment has an unusual structure (very high returns, very long duration, or multiple sign changes), providing a guess closer to the expected result, such as 0.25 for a 25% return, reduces the chance of a #NUM! error.
Yes. Google Sheets has a MIRR function: =MIRR(values, finance_rate, reinvest_rate). Modified IRR corrects for one of the main criticisms of standard IRR, which assumes reinvestment of interim cash flows at the IRR itself. MIRR lets you specify a realistic reinvestment rate (often a lower hurdle rate) and a finance rate (your cost of capital). For most investment analysis, XIRR is preferred over standard IRR, and MIRR is used when reinvestment assumptions matter for comparing alternatives.
Written by
Hassaan Rasheed
Web Developer & Content Researcher
Hassaan builds calculators and writes research-backed guides on finance, math, payroll, and construction topics. Every number in his articles is sourced from official data and worked through by hand.
View LinkedIn Profile