3rd Percentile Baby: What Low Growth Percentiles Mean for Parents (2026)
3rd percentile means a baby's measurement is near the lower tail of a same-age, same-sex growth standard. What the number shows and what context it cannot replace.
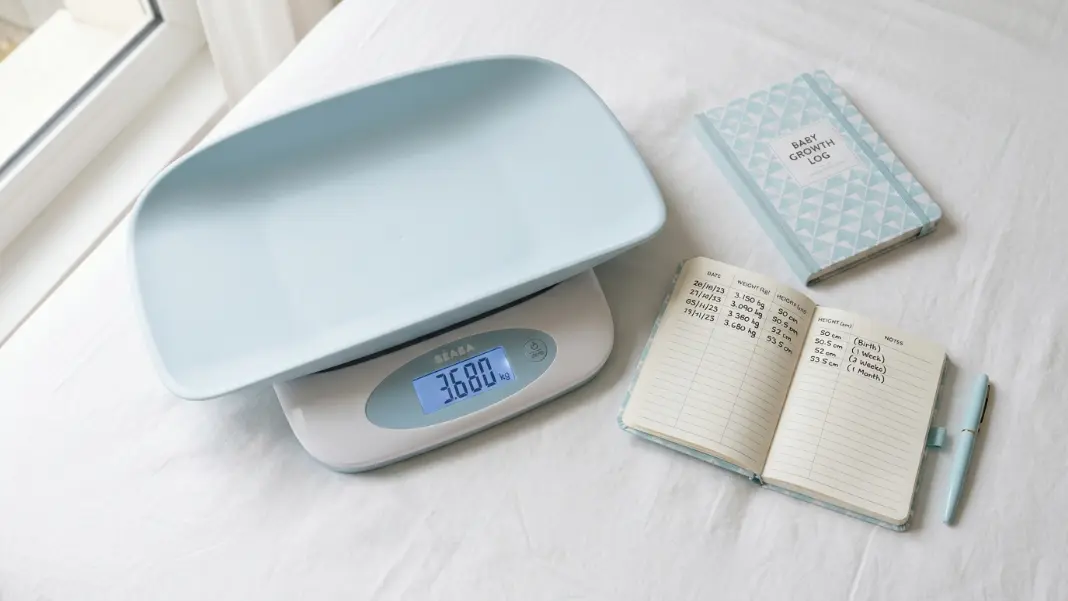
The number on the growth chart can feel like a verdict. When a weight plots at the 3rd percentile, about 3% of the modeled same-age, same-sex reference distribution is lower and about 97% is higher. That is a statistical position, not an answer about why the baby plots there.
Meaning comes from measurement quality, earlier growth, weight relative to length, feeding, development, symptoms, gestational history, and clinical examination. The Baby Percentile Calculator estimates WHO weight-for-age or recumbent-length-for-age percentile from age and sex. It does not calculate head-circumference percentile and it cannot diagnose growth faltering, undernutrition, or any medical condition.
What the 3rd Percentile Actually Measures#
A weight at P3 plots above about 3% of the modeled WHO weight-for-age distribution for the same completed month and sex. A length at P3 has the analogous meaning on the separate length-for-age standard. Head circumference and weight-for-length use separate standards and answer different questions.
P3 is one centile line that WHO makes available; the modeled distribution continues below it. It is not a universal boundary between healthy and unhealthy growth. The primary tables are on WHO's weight-for-age, length/height-for-age, and head-circumference-for-age pages.
The percentile also depends on which measurement is being plotted. Weight-for-age does not show whether weight is proportionate to length, and length-for-age does not assess weight status. For children under 2, clinicians can use the WHO weight-for-length standard alongside the age-based charts. The CDC guidance for using WHO charts from birth to age 2 emphasizes accurate serial measurements and appropriate chart selection.
When Family Size May Be Part of the Context#
Family size can help explain why a baby tracks near a lower centile, but it cannot prove that genetics is the only explanation. Feeding, illness, gestational history, measurement error, and other factors can produce a similar plotted pattern.
A stable series of accurate measurements can be reassuring context, particularly when weight-for-length, feeding, development, and examination are also reassuring. It still does not let an online article label a baby “constitutionally small” or rule out a problem.
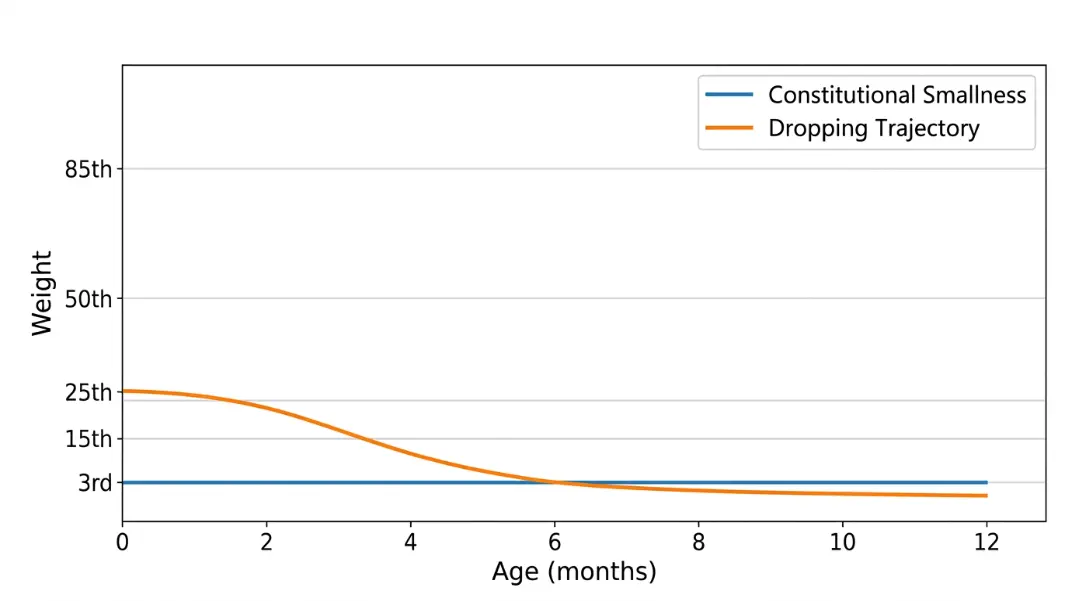
A baby plotted near P3 across several visits presents a different pattern from one plotted at P25 and later at P3. The second pattern is a reason to review the measurements and wider context, not proof of a particular cause. A stable low trajectory also should not override feeding difficulty, weight loss, dehydration, persistent symptoms, or developmental concerns.
How Growth Velocity Changes the Picture#
Growth velocity is change over time, not the static percentile at one visit. It should be calculated from accurately measured values and the interval between them. Percentile movement is related to velocity, but the two are not interchangeable.
Consider this illustrative series:
| Age | Percentile |
|---|---|
| Birth | 25th |
| 2 months | 15th |
| 4 months | 8th |
| 6 months | 3rd |
This series changes from P25 to P3 over four months. Crossing centile spaces is used as a screening flag in some guidance, but it is not a diagnosis. Scale differences, clothing, age entry, illness, feeding, and true growth can all affect the pattern.
Compare that to:
| Age | Percentile |
|---|---|
| Birth | 3rd |
| 2 months | 4th |
| 4 months | 3rd |
| 6 months | 3rd |
This second series stays near a similar centile. That may be more reassuring than a large shift, but it does not determine follow-up without the baby's full clinical context.
Weight gain changes rapidly with age, so one fixed weekly target should not be applied across infancy. WHO publishes separate weight-velocity standards, while the Baby Weight Percentile Chart by Age provides selected weight-for-age reference values. A clinician can decide which comparison is appropriate and whether the measurement interval is long enough to interpret.
What Doctors Assess When a Baby Sits Below the 3rd Percentile#
When a measurement plots near P3, a clinician may review several areas. This is not a checklist that assigns a diagnosis or a referral from the percentile alone.
Are weight, length, and head circumference proportionally small?
Weight, length, and head circumference provide different information. Similar age-based percentiles do not prove that a baby is proportionate, and subtracting weight-for-age from length-for-age does not assess weight status. For children under 2, weight-for-length is the direct proportionality standard. Head circumference is measured and interpreted separately by the clinical team; this site's calculator does not calculate it.
What was the birth weight and gestational age?
Birth weight must be compared with gestational age and the sex-specific birth reference used by the care team. A gram value alone cannot establish small for gestational age (SGA). Prenatal/birth size classifications and a later WHO postnatal percentile are separate measurements.
Is feeding volume adequate?
Feeding method, frequency, transfer or volume, formula preparation, swallowing, vomiting, and urine output may all be relevant. A percentile cannot identify inadequate intake or its cause. Feeding difficulty, poor suck, persistent vomiting, or fewer wet diapers should be discussed promptly with the baby's clinician.
Are developmental milestones on track?
Development adds important context, but meeting milestones does not prove that growth is adequate, and a low percentile does not explain a developmental delay. Share any developmental concern with the child's clinician rather than waiting for another growth-chart point.
Preterm Babies and Corrected Age#
For a baby born preterm, the chart and age used for growth assessment may need adjustment. Corrected age is chronological age minus the number of weeks born before 40 weeks. The neonatal and pediatric team should decide when to use a preterm-specific chart and when to transition to WHO standards.
A baby born at 32 weeks was 8 weeks early. At 4 months chronological age, that is about 2 months corrected age. Using 4 months or 2 months selects different WHO rows and can materially change the percentile, which is why the age basis should be documented.
There is no one stop date that this article should prescribe for every preterm child. Ask which chart and age basis the clinical team is using and how long they recommend correction for that child.
The 99th Percentile Baby post explains the same statistical-versus-clinical distinction at the upper end of weight-for-age.
When to Contact the Baby's Clinician#
Contact the baby's clinician about the measurement and sooner when it comes with symptoms or a clear change. Relevant examples include:
- Weight loss or a substantial shift from earlier accurate measurements
- Not regaining birth weight on the timeline set by the newborn-care team
- Persistent vomiting, poor suck, feeding refusal, or difficulty staying awake to feed
- Fewer wet diapers, signs of dehydration, breathing difficulty, unusual sleepiness, or other acute symptoms
- Concerns about development, swallowing, stooling, illness, or formula preparation
The clinician decides whether the next step is a repeat measurement, feeding observation, examination, laboratory testing, referral, urgent assessment, or routine follow-up. A percentile alone cannot choose that pathway.
Terms such as “growth faltering” describe a clinical concern identified from a broader pattern; they are not synonyms for P3. Definitions and action thresholds vary by guideline and clinical setting.
Understanding what the chart tracks, and what it does not, makes every growth visit more useful. What Does Baby Percentile Mean explains the WHO LMS method and why printed centile lines are statistical markers rather than guaranteed health boundaries.
A series near P3 can be reassuring in some contexts, but this article cannot declare a baby healthy from those facts alone. The chart supports a clinical assessment; it does not predict outcomes or establish a diagnosis on its own.
P3 means about 3% of the modeled same-age, same-sex distribution plots lower and about 97% plots higher for that specific measurement. Weight, length, head circumference, and weight-for-length each use separate standards. P3 is not a universal boundary between healthy and unhealthy growth.
The percentile alone cannot answer that. A stable trajectory and reassuring wider assessment can provide context, while a large shift, weight loss, feeding difficulty, dehydration, persistent symptoms, or developmental concerns may change the response. Ask the baby's clinician to interpret the actual measurements.
Growth faltering is a clinical concern based on growth pattern and wider assessment, not another name for P3. Crossing centile spaces can be one screening signal in some guidelines, but definitions vary and the chart alone cannot identify the cause.
Preterm growth assessment may use a preterm-specific chart, corrected age, or a later transition to WHO standards. Corrected age is chronological age minus weeks born before 40 weeks; for example, 4 months chronological age minus 8 weeks is about 2 months corrected age. Follow the neonatal or pediatric team's chart and correction plan.
Ask the baby's clinician to confirm the measurement, chart, age basis, earlier trajectory, and weight-for-length. Share feeding details, urine output, symptoms, development, gestational history, and family context. Seek prompt medical advice for poor feeding, persistent vomiting, fewer wet diapers, unusual sleepiness, breathing difficulty, or other acute concerns.
SGA generally describes birth weight below P10 for gestational age on the birth standard being used. P3 on a later WHO postnatal chart is a separate age- and sex-specific position. One cannot be converted directly into the other, and neither identifies a cause by itself.
Written by
Hassaan Rasheed
Web Developer & Content Researcher
Hassaan builds calculators and writes source-linked guides across the site's subject areas. Calculator methods and reference data are documented in each guide so readers can verify the underlying sources.
About the author and methods