Private Equity IRR: Gross vs Net Returns, J-Curve, and Fund Benchmarks (2026)
PE funds report gross IRR; LPs receive net. How the gap is calculated, why funds show negative IRR early, and the three metrics that tell the full story.
Private equity fund performance reporting is built around IRR, but the number being reported is not always the number that matters to you as an investor. PE funds publish gross IRR, which measures investment-level returns before fees. Limited partners receive net IRR, which subtracts management fees and carried interest. The gap between those two numbers is where most of the confusion about private equity returns starts.
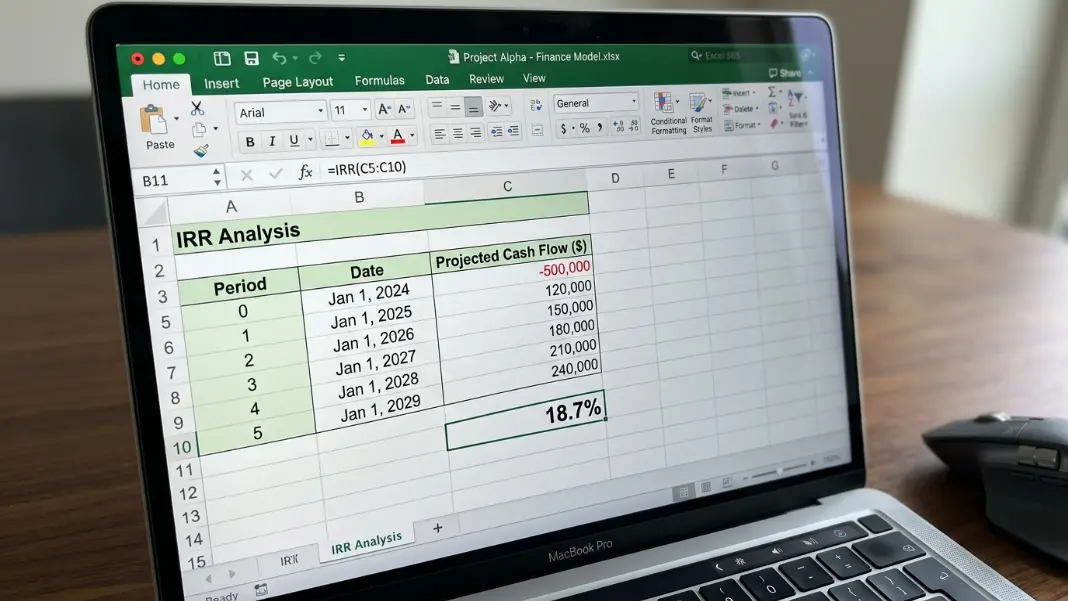
The IRR Calculator computes standard IRR for any cash flow series. This post covers the fund-level mechanics that make PE IRR different from a simple investment calculation: the gross-to-net distinction, how the J-curve shapes early reporting, since-inception IRR, and how to read the three metrics (IRR, DPI, TVPI) that appear on every fund performance report.
Gross IRR vs Net IRR: The Gap That Defines Fund Performance
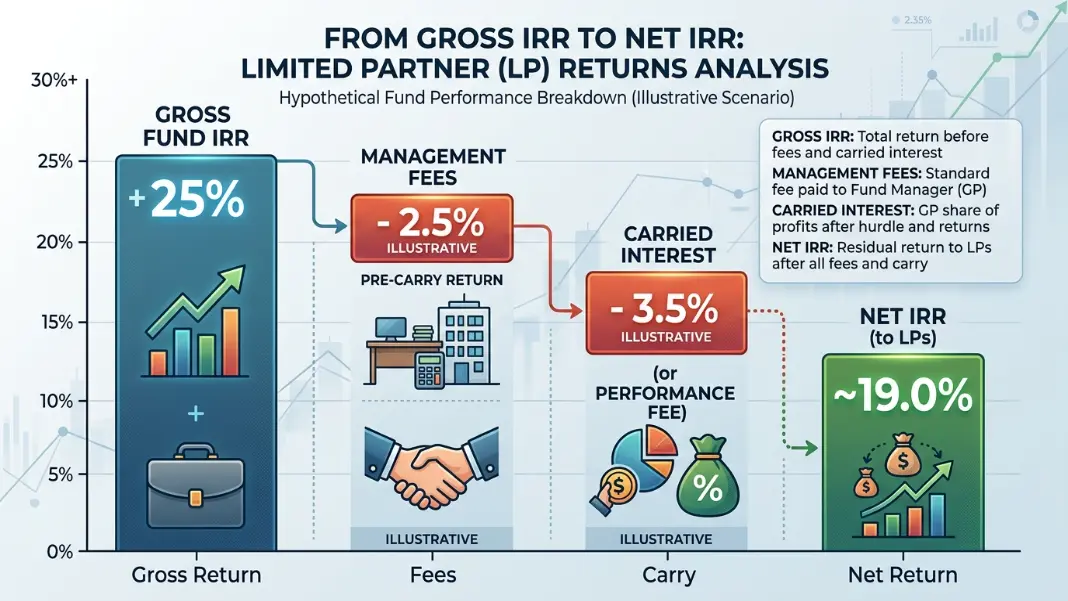
Gross IRR measures the return generated at the portfolio company level before the fund management company takes its share. Net IRR is what limited partners actually receive after all fees.
The standard private equity fee structure that creates this gap:
- Management fee: 2% of committed capital annually, charged from day one of the fund, regardless of performance
- Carried interest (carry): 20% of profits above the hurdle rate (typically 8% net IRR), paid to the GP on exit
These fees reduce LP returns in a predictable way:
Gross IRR: 25%
Management fees over 10-year fund life: reduce net by approximately 2-4%
Carried interest (20% of upside above 8%): reduces net by 3-5% on a 25% gross fund

Estimated Net IRR to LPs: 18-21%
The gross-to-net gap narrows for mediocre funds and widens for strong ones, because carried interest is a percentage of upside. A fund that returns exactly 8% gross (the hurdle) pays no carry at all; the gross-to-net gap is only management fees, roughly 2-3 percentage points. A fund returning 30% gross pays 20% carry on everything above the 8% hurdle, creating a 4-6 point gap.
Why this matters for LP due diligence: Fund managers prefer to quote gross IRR in marketing materials because it is the larger number. A fund advertising "25% IRR" is typically showing gross. The LP-relevant figure is net, which runs 15-18% for the same fund. Always confirm whether quoted IRR figures are gross or net before comparing across managers or strategies.
For the underlying IRR calculation mechanics before the fee layer, the IRR Formula Guide covers how discounted cash flow math produces the single rate embedded in a series of investment returns.
Private Equity IRR Benchmarks by Fund Type
PE funds set IRR targets before deploying capital, and these targets vary widely by strategy and risk level. The figures below represent gross IRR targets disclosed in LP agreements and fund marketing materials.
The table below shows target gross and net IRR ranges by PE strategy.
| PE Strategy | Gross IRR Target | Net IRR Target | Typical Investment Hold | Fund Life |
|---|---|---|---|---|
| Large-Cap Buyout | 20-25% | 15-20% | 4-6 years | 10-12 years |
| Mid-Market Buyout | 22-28% | 17-22% | 3-5 years | 8-10 years |
| Growth Equity | 22-30% | 17-25% | 3-5 years | 8-10 years |
| Early-Stage VC | 30-40%+ | 25-35%+ | 5-10 years | 10-15 years |
| Late-Stage VC | 20-30% | 15-25% | 2-4 years | 8-12 years |
| Infrastructure PE | 12-18% | 9-14% | 7-15 years | 12-20 years |
These are targets, not guarantees. Cambridge Associates data shows that top-quartile buyout funds have historically delivered 20-25% net IRR, while median buyout funds deliver 12-15% net. VC top-quartile funds can exceed 30% net, but the median VC fund has historically underperformed public markets after accounting for the J-curve drag in early years.
Venture capital targets are higher because the expected loss rate is also higher. Early-stage VC funds anticipate 50-60% of portfolio companies returning little or nothing. The few that succeed need to return 10x-30x to drive a fund-level IRR in the 25-35% range, which is why VC funds hold larger numbers of smaller positions than buyout funds.
For broader IRR benchmarks across real estate, public markets, and other asset classes, the What Is a Good IRR Guide provides the full comparison with a framework for evaluating what "good" means in each context.
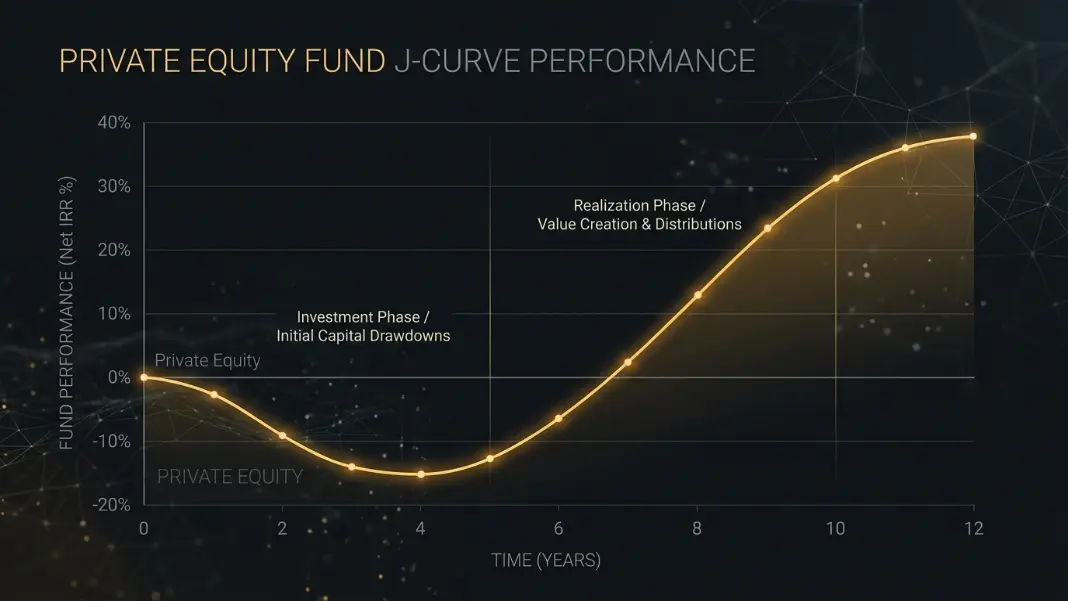
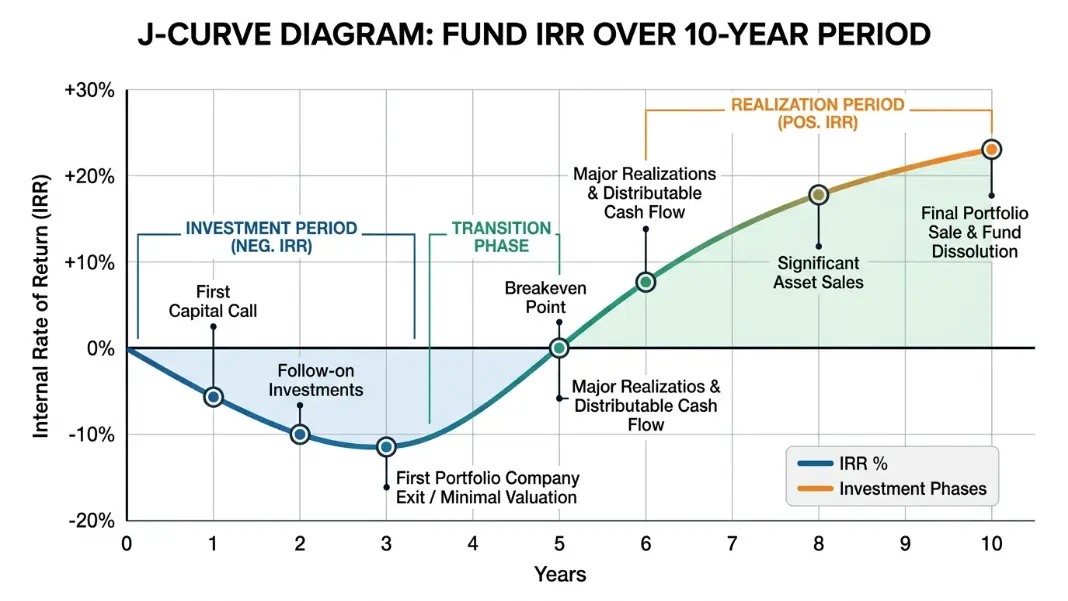
The J-Curve: Why PE Funds Show Negative IRR in Years 1 to 3
The J-curve is one of the most misunderstood aspects of private equity performance reporting. It describes the typical trajectory of a fund's IRR (or reported NAV) over its life: early years show negative or very low reported returns, which then rise through the middle years and peak in the later periods.
Typical fund-level IRR trajectory:

Year 1:  -15%   (management fees charged, no exits, companies valued at cost)
Year 2:   -8%   (fees continuing, first value creation underway)
Year 3:   -2%   (portfolio companies building, some early write-downs)
Year 4:   +5%   (first exits, portfolio stabilizing)
Year 5:  +10%   (more realizations, unrealized portfolio marked up)
Year 7:  +18%   (major exits completed, return profile crystallizing)
Year 10: +22%   (fund winding down, final distributions)
Three structural factors drive the J-curve:
Fees are immediate; returns are deferred. Management fees start at fund closing. Investments take 2-4 years to mature. In year 1, you have paid 2% in fees but received no distributions.
Investments are initially valued at cost. PE funds hold private companies that cannot be marked to market daily. When first acquired, they are carried at the purchase price. If early investments face headwinds, initial NAV drops below invested capital.
Value creation takes time. Buyout strategies require 2-4 years to implement operational improvements, reduce leverage, and reposition companies for sale. The work is underway but not yet reflected in reported valuations.
The practical implication: do not evaluate a PE fund's performance in the first 3 years. A negative IRR in year 2 tells you almost nothing about the fund's eventual outcome. The standard industry rule is to withhold judgment until the fund is at least 5 years in and has completed at least 30-40% of planned capital deployment.
Since-Inception IRR: How to Read a Fund Performance Report
"Since-inception IRR" is the standard metric for PE fund track records. It calculates IRR from the first capital call to the current date, treating the current net asset value (NAV) of unrealized investments as a terminal positive cash flow.
Since-inception IRR calculation inputs:
- All capital calls to LPs (negative cash flows)
- All distributions to LPs (positive cash flows)
- Current NAV of unrealized portfolio (treated as a positive cash flow as of today)

Output: IRR from fund inception to the reporting date
The treatment of current NAV is where track record quality varies. Funds that aggressively mark up unrealized investments will show higher since-inception IRR than funds using conservative valuations, even with identical actual cash distributions to LPs. This is why DPI (Distributions to Paid-In) matters as a companion metric: it only counts money that has actually been paid out.
Reading a fund report: Most PE fund quarterly reports show three metrics side by side.
The table below shows what each metric means and what strong performance looks like.
| Metric | What It Measures | Strong Performance |
|---|---|---|
| Net IRR (since inception) | Annualized return to LPs including unrealized portfolio at current NAV | Top-quartile: 20%+ for buyout, 25%+ for VC |
| DPI (Distributions to Paid-In) | Cash actually returned / capital called | 1.0x = returned capital; 2.0x+ is strong for a mature fund |
| TVPI (Total Value to Paid-In) | (NAV + Distributions) / Capital called | 1.5x+ mid-life; 2.0x+ at maturity |
A fund in year 6 with 18% net IRR, 1.2x DPI, and 1.9x TVPI is performing well: the IRR is strong, capital is beginning to return (1.2x DPI means 120% of invested capital has been distributed), and the overall value multiple including unrealized assets is approaching 2x.
A fund in year 8 with 22% net IRR, 0.6x DPI, and 2.4x TVPI needs more scrutiny: the return on paper is excellent, but only 60% of capital has been returned in cash. The remaining 1.8x TVPI depends on realizing the unrealized portfolio at current marks, which may or may not happen.
IRR vs TVPI vs DPI: The Three Numbers That Tell the Full Story
No single metric fully captures PE fund performance. The three standard metrics work together.
High IRR with low DPI suggests strong paper returns but limited realized value. This can mean the manager is marking up unrealized investments aggressively, or that exits have been delayed. Not automatically bad, but requires scrutiny of the underlying portfolio marks.
High DPI with moderate IRR has one major advantage: the returns are real. Cash was distributed, tested in actual market transactions, and is in LP accounts. If IRR is moderate (15-18%) but DPI is above 1.5x at fund maturity, the performance is credible regardless of what the headline IRR might look like versus top-quartile benchmarks.
High TVPI with aging unrealized assets is the scenario that warrants most caution. If TVPI is 2.5x but the fund is in year 9 and DPI is only 0.7x, most of the claimed value is still in unrealized companies. Whether that value is real depends entirely on exit timing and market conditions for those specific assets.
For LP due diligence, the standard approach is to evaluate IRR alongside DPI across multiple consecutive fund vintages from the same manager. A manager with 20%+ net IRR across three consecutive funds, with DPI above 1.5x at each fund's maturity, has a credible track record. Strong single-vintage performance with weaker subsequent vintages is a yellow flag worth examining before committing to the next fund.
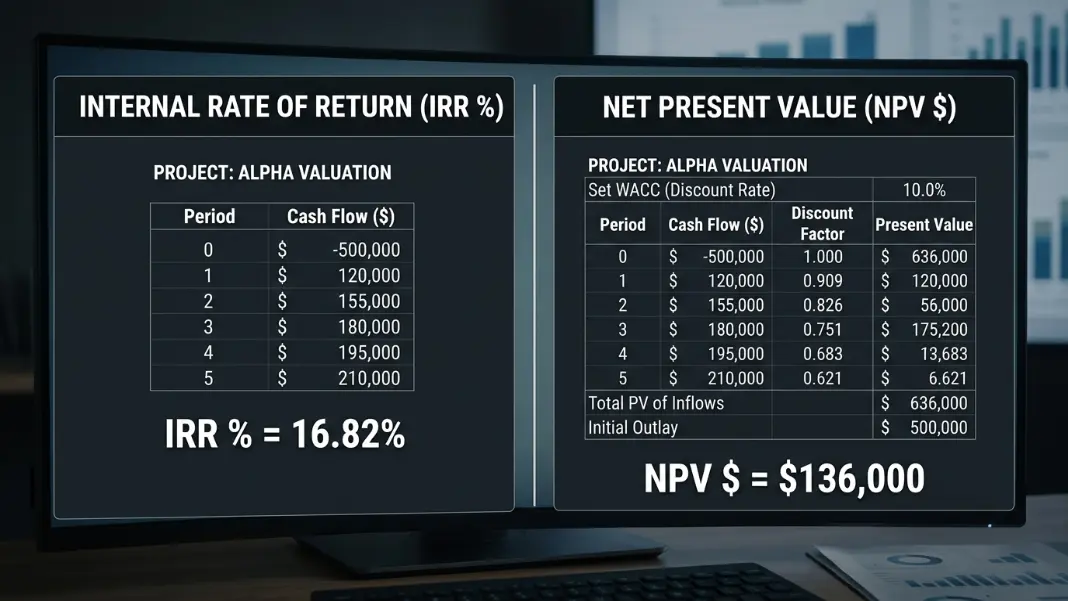
The IRR vs NPV Guide covers the mathematical relationship between IRR and net present value, which is the underlying framework for both investment-level and fund-level return analysis.
Large-cap buyout funds target 20-25% gross IRR, delivering 15-20% net to LPs after fees. Mid-market buyout and growth equity target 22-28% gross. Venture capital targets 30-40%+ gross at the early stage to account for high portfolio failure rates. Cambridge Associates data shows top-quartile buyout funds historically deliver 20-25% net, while median buyout funds return 12-15% net. Whether a given IRR is good depends on fund strategy, vintage year, and market conditions during the investment period.
Gross IRR measures investment returns before management fees and carried interest. Net IRR is what limited partners actually receive after deducting the fund manager's 2% annual management fee and 20% carried interest on profits above the hurdle rate. The gross-to-net gap is typically 3-6 percentage points depending on fund performance. A fund reporting 25% gross IRR delivers approximately 18-21% net to LPs. Always compare fund track records on a net basis, since gross favors the manager's marketing materials over LP-relevant returns.
The J-curve describes the pattern of PE fund returns over time: negative or flat in years 1-3, rising through years 4-7, and peaking in later years as investments are realized. The early negative returns result from management fees being charged immediately while investments are not yet mature, and unrealized companies being valued at cost. As portfolio companies are sold, distributions create the positive returns that compound the fund's IRR upward. The J-curve is normal and expected, not a sign of poor performance.
Since-inception IRR calculates the fund's return from the first capital call to the current date, treating the current net asset value (NAV) of unrealized investments as a terminal positive cash flow. It is the standard metric for PE fund performance reporting. Because it includes unrealized assets at their current marked value, it is partly an estimate. DPI (distributions to paid-in capital) is the more conservative companion: it only counts cash actually distributed to investors, not paper gains.
DPI (Distributions to Paid-In) is the ratio of cash distributed to LPs divided by capital called. A DPI of 1.0x means the fund has returned exactly the capital invested in cash; 2.0x means LPs received twice their invested capital back as actual distributions. DPI is the most conservative performance metric because it only counts realized returns. A mature fund with DPI above 1.5x has demonstrated real cash returns tested in actual market transactions, not just marked-up valuations.
VC IRR targets are higher (30-40%+ gross for early-stage) because VC funds expect 50-60% of investments to produce little return. Successful investments need to return 10x-30x to drive fund-level IRR. Buyout IRR targets are lower (20-25% gross) because buyout deals use financial leverage, invest in established businesses, and aim for diversified consistent returns rather than power-law outcomes. VC IRR is also more volatile across vintages because startup exits depend heavily on IPO and M&A market conditions.
Written by
Hassaan Rasheed
Web Developer & Content Researcher
Hassaan builds calculators and writes research-backed guides on finance, math, payroll, and construction topics. Every number in his articles is sourced from official data and worked through by hand.
View LinkedIn Profile