30th Percentile Baby: What Below-Average Growth Means (2026)
30th percentile baby means smaller than 70% of same-age babies. Why this is normal, what growth trajectory means, and when doctors actually intervene.

The phrase "below average" tends to alarm parents more than the number warrants. Hearing that your baby is at the 30th percentile can feel like a warning. Pediatricians do not treat it as one. The clinical normal range runs from the 3rd percentile to the 97th, and the 30th sits comfortably in the lower-middle portion of that range with no clinical significance on its own.
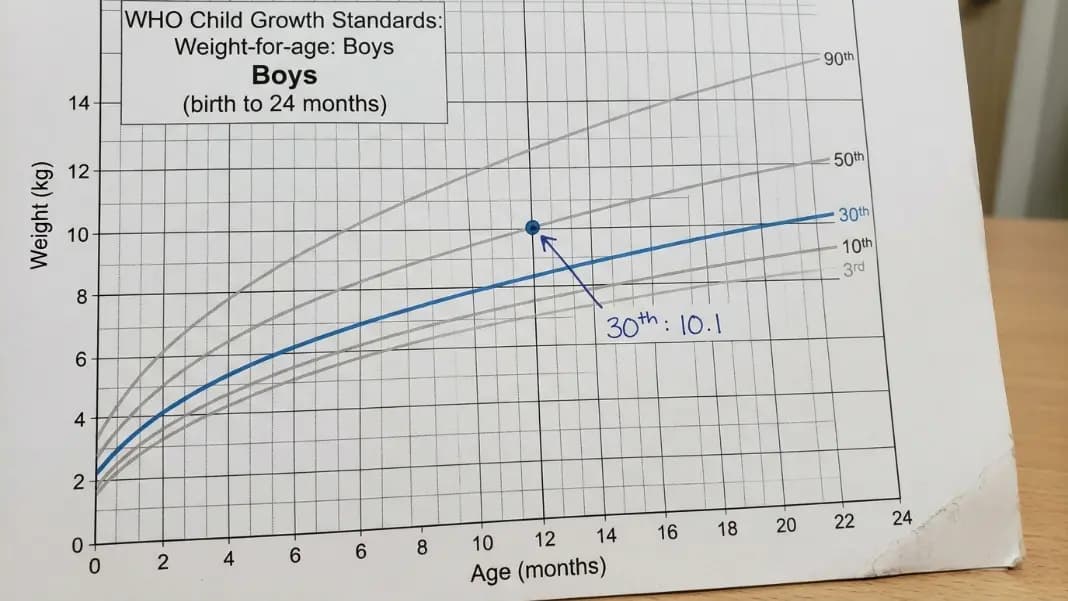
What the 30th percentile tells you is that your baby weighs more than 30% of babies the same age and sex on the WHO growth reference chart. It says nothing about whether your baby is growing correctly over time. That judgment requires multiple readings, not one. The Baby Percentile Calculator plots your baby's measurements against WHO reference data across visits and shows you whether the growth curve is holding steady rather than declining.
What 30th Percentile Means and Why It Is Not a Warning Sign
The 30th percentile is a position on a reference chart, not a score. It means 30% of healthy babies the same age and sex in the WHO reference population weigh the same or less. The other 70% weigh more. That is the complete definition.
Pediatricians use the term "normal range" to describe percentiles between the 3rd and 97th. This range is intentionally wide because healthy babies vary enormously. A baby at the 30th percentile for weight is growing at a rate consistent with millions of other healthy babies worldwide. There is no minimum percentile target a baby must reach to pass a well-baby visit.
The number that most often confuses parents is the median: the 50th percentile. It is the midpoint of the reference population, not a standard or target. Exactly half of healthy babies weigh more than the 50th percentile baby, and half weigh less. A 30th percentile baby is on the lower side of that distribution: smaller than average, which is entirely compatible with healthy growth.
The 30th percentile also applies separately to weight, length, and head circumference. A baby can be at the 30th percentile for weight and the 55th for length, producing a leaner body type that still falls within healthy ranges for every individual measurement. These three measurements are tracked and interpreted independently.
How the 30th percentile fits on the clinical scale:
| Percentile Range | Clinical Context |
|---|---|
| Below 3rd | At the clinical threshold for assessment |
| 3rd to 10th | Low, monitored more closely for trajectory |
| 10th to 25th | Below average, no intervention if stable |
| 25th to 75th | Average range, 30th percentile sits here |
| 75th to 90th | Above average |
| 90th to 97th | High, also monitored in context |
The 30th percentile falls in the same clinical band as the 35th or 40th. A baby growing consistently along any percentile within the 3rd to 97th range demonstrates a healthy individual growth pattern.
How WHO Growth Charts Produce the Percentile Number
The WHO growth charts used in most pediatric practices are derived from the WHO Multicentre Growth Reference Study, completed in 2006. Researchers followed 8,440 children across six countries (Brazil, Ghana, India, Norway, Oman, and the United States) from birth to 60 months under conditions designed to represent optimal growth: breastfed, non-smoking households, no significant illness, and regular medical care.
The study was designed to show how children should grow under good conditions, not merely how they do grow in a given national population. This distinction matters: the WHO charts represent a growth standard rather than a descriptive average of a single country's population. This is why the WHO charts replaced older population-descriptive references in many countries over the past two decades.
The underlying calculation uses the LMS statistical method. L is a transformation factor that adjusts for skewness in the data distribution, M is the median (the 50th percentile value), and S is the coefficient of variation that describes the spread. These three values are calculated for each age and sex combination separately and define the complete percentile curve. Your baby's percentile is derived from where their measurement falls relative to M at their exact age, adjusted by L and S.
What this means in practice: a baby who is 5 months and 20 days old should be plotted at that exact age, not rounded to 5 months or 6 months. The percentile curves change continuously with age, and rounding introduces error that affects interpretation.
The What Does Baby Percentile Mean guide covers the WHO chart methodology in detail, including why the CDC growth chart (used for children over 2 in the United States) and the WHO chart can produce different percentile readings from the same weight measurement.
Approximate WHO reference weights at the 30th percentile:
These values are approximate from WHO tables. Actual clinical charts use continuous curves.
| Age | Boys 30th Percentile | Girls 30th Percentile |
|---|---|---|
| Birth | 3.1 kg (6.8 lbs) | 3.0 kg (6.6 lbs) |
| 3 months | 5.5 kg (12.1 lbs) | 5.0 kg (11.0 lbs) |
| 6 months | 7.4 kg (16.3 lbs) | 6.9 kg (15.2 lbs) |
| 9 months | 8.8 kg (19.4 lbs) | 8.1 kg (17.9 lbs) |
| 12 months | 9.7 kg (21.4 lbs) | 9.0 kg (19.8 lbs) |
| 18 months | 10.9 kg (24.0 lbs) | 10.2 kg (22.5 lbs) |
| 24 months | 12.0 kg (26.5 lbs) | 11.3 kg (24.9 lbs) |
Growth Trajectory vs One Reading: The Difference That Actually Matters
A single percentile reading at one visit is almost never sufficient to assess whether a baby is growing appropriately. What pediatricians look for is trajectory: whether a baby is maintaining its position on the chart across visits, rising toward a consistent curve, or falling away from where it has been.
A baby who has consistently measured near the 30th percentile across their first year of life is demonstrating exactly what a growth chart is designed to show: a stable individual growth pattern. That consistency is the reassuring finding.
What triggers concern is not the percentile number itself but the direction of change over time. A baby who measured at the 50th percentile at birth, then the 38th at 4 months, then the 25th at 8 months shows a declining pattern across three measurement periods. The absolute percentile at the final visit matters less than the direction of movement across all three.
Centile crossing:
The clinical term for a baby whose growth curve shifts significantly downward is "centile crossing." The WHO and the American Academy of Pediatrics generally consider crossing two major centile lines downward as a threshold that warrants evaluation. Major centile lines on standard charts correspond roughly to the 3rd, 10th, 25th, 50th, 75th, 90th, and 97th percentiles.
Two major centile lines downward corresponds to drops like:
- 50th percentile to 15th percentile
- 30th percentile to 5th percentile
- 15th percentile to below the 3rd
A baby stable at the 30th percentile across multiple visits has not crossed any centile lines. There is nothing to evaluate.
Parental height and genetics:
A baby's expected position on the growth chart is substantially influenced by parental genetics. Two parents who are both below average in height and weight will, on average, have a baby who grows at a below-average percentile. A 30th percentile baby from two small-statured parents is likely tracking their genetic potential, not experiencing a growth failure.
Pediatricians account for this through a calculation called mid-parental height, which estimates a child's expected adult height range from the average of both parents' heights with an adjustment for sex. A child consistently at the 30th percentile whose mid-parental height estimate corresponds to the lower portion of the normal range is growing entirely on their expected trajectory.
Where Pediatricians Draw the Line: The 10th Percentile Threshold
The 10th percentile is the most widely cited clinical reference point in routine growth monitoring. Below the 10th percentile is where pediatricians begin asking additional questions and may increase the frequency of weight checks, though a consistent position near the 10th with a stable trajectory is not automatically a diagnosis.
The 3rd percentile is the lower boundary of the standard normal range on WHO charts. A baby consistently measuring below the 3rd percentile, or a baby whose trajectory has recently crossed two major centile lines to reach below the 3rd, is at the threshold for formal clinical assessment.
Small for gestational age:
Small for gestational age (SGA) is a classification applied at birth based on weight relative to gestational age, not a postnatal growth percentile. A baby is classified as SGA if their birth weight falls below the 10th percentile for their specific gestational age at the time of delivery. This classification informs the monitoring plan in the newborn period. Many SGA babies demonstrate catch-up growth and move above the 10th percentile during their first year. That catch-up pattern is a separate assessment from routine postnatal growth tracking.
Failure to thrive:
Failure to thrive (FTT) is a clinical pattern, not a single-visit finding. The criteria vary by source but generally require crossing two or more major centile lines downward across multiple visits, or a weight persistently below the 3rd percentile in a child with declining growth velocity. FTT is not defined by a low percentile at a single visit. A baby arriving at a 9-month appointment at the 30th percentile who was at the 32nd at 6 months shows growth velocity within normal variation. That is not FTT.
The Baby Weight Percentile Chart by Age shows the complete WHO reference tables for weight-for-age from birth to 24 months, with the major percentile lines labeled so you can see exactly where your baby's measurements sit across visits.
Middle Percentiles in Context: 17th, 33rd, and the Normal Range
Parents who search for the 30th percentile often also search for adjacent numbers: 17th, 25th, 33rd, 40th. Growth tracking apps and medical software report varying decimal percentile readings depending on how precisely they calculate age, which is why parents see different specific numbers across different tools.
A baby at the 17th percentile weighs more than 17% of same-age babies. 83% weigh more. Written out that way, it sounds low, but the 17th percentile sits between the 10th and 25th, comfortably within the clinical normal range for any baby with a stable trajectory. The 17th is not a flag on its own.
The 33rd percentile is just below the median by 17 percentage points: two-thirds of same-age babies weigh more. In clinical terms, the 33rd is functionally identical to the 30th. The same trajectory rules apply. A stable 33rd percentile across six months of visits tells the same story as a stable 30th.
Why different apps give different percentile numbers:
Growth chart apps use slightly different reference datasets, interpolation methods, and rounding conventions for age. The same weight entered into two apps can produce a 28th percentile reading in one and a 32nd in another. Both readings are telling you the same thing: below average by a small margin, within the normal range. Differences of a few percentage points between apps are measurement rounding, not clinically meaningful variation.
The 50th percentile is not a goal:
This is the most consistent misunderstanding parents bring to well-baby visits. The 50th percentile is the statistical median of the reference population. It is not a standard, a goal, or a threshold. There is no health benefit to being at the 50th rather than the 30th. A baby who grows steadily along the 30th percentile is following a healthy growth curve. The goal is a stable trajectory, not reaching a specific percentile number.
For situations where growth does fall below the clinical thresholds and formal evaluation is underway, the 3rd Percentile Baby guide covers the specific clinical criteria, evaluation steps, and what parents can expect at appointments where inadequate growth is being assessed rather than simply monitored.
Yes. The 30th percentile falls within the clinical normal range, which spans the 3rd to 97th percentile on WHO growth charts. It means your baby weighs more than 30% of same-age babies in the WHO reference population. Pediatricians do not flag babies at the 30th percentile as underweight or growth-delayed unless the trajectory shows a significant downward shift across multiple visits. A stable 30th percentile across several well-baby visits is a reassuring finding, not a concerning one.
The 30th percentile means your baby's weight, length, or head circumference is at or above 30% of babies the same age and sex in the WHO Multicentre Growth Reference Study. It does not mean your baby is behind or failing to grow. It means your baby is smaller than average, which is a normal variation across the healthy population. The percentile only becomes clinically relevant if it drops significantly across multiple visits, not because of where it sits at one appointment.
Concern is warranted when a baby drops across two major centile lines downward over several visits, not when a baby is consistently at any single low percentile. A baby stable at the 30th percentile needs no intervention. Concern is appropriate when a baby drops from the 50th to the 15th percentile over several months, or when weight falls below the 3rd percentile with a declining trajectory. A single low reading without a declining pattern typically warrants watchful monitoring, not clinical intervention.
The 3rd percentile is the lower boundary of the standard normal range on WHO growth charts. A baby consistently below the 3rd, or whose trajectory has crossed two major centile lines downward to reach below the 3rd, is at the threshold for formal clinical assessment. Between the 3rd and 10th percentile, pediatricians typically increase monitoring frequency. A stable trajectory just below the 10th percentile is not automatically a diagnosis but warrants more frequent check-ins than a baby in the 25th to 75th range.
Baby percentile is calculated by comparing your baby's measurement to the WHO Multicentre Growth Reference Study population at the same age and sex. The WHO uses the LMS statistical method: L is a transformation factor for data skewness, M is the median at that age, and S describes the spread. Your baby's measurement converts to a z-score using those three values, and the z-score maps to a percentile position. This is why age must be recorded precisely: the LMS values shift continuously by day, not just by month.
Not necessarily. A baby consistently at the 30th percentile is growing at a normal rate for their position on the chart. Increasing feeding to raise the percentile is not a clinical goal when the trajectory is stable. Pediatricians evaluate feeding adequacy by checking that a baby is meeting growth velocity targets, producing an appropriate number of wet diapers per day, and reaching developmental milestones. A stable percentile, even at the 30th, generally indicates that nutrition is adequate for that baby's individual growth pattern.
Written by
Hassaan Rasheed
Web Developer & Content Researcher
Hassaan builds calculators and writes research-backed guides on finance, math, payroll, and construction topics. Every number in his articles is sourced from official data and worked through by hand.
View LinkedIn Profile