75th Percentile Baby: What Above-Average Growth Means (2026)
75th percentile baby means heavier than 75% of same-age babies. Why this is normal, what stable trajectory means, and when doctors look closer.

Most parents breathe easier when the pediatrician mentions the 75th percentile. It registers as above average, which tends to feel like good news and the end of the conversation. What it actually means takes a little more unpacking than the checkup summary typically covers.
The 75th percentile means your baby weighs more than 75% of same-age babies on the WHO growth reference chart. That is a normal position with no clinical concern attached. But the same trajectory rules that apply at the 30th percentile apply here too. A baby stable at the 75th across six months of visits tells a different story than one whose curve has been climbing from the 45th to the 75th across three consecutive appointments. The Baby Percentile Calculator plots measurements against WHO reference data across visits so you can see the trend, not just the latest number.
What 75th Percentile Means on a Growth Chart
The 75th percentile is a position on a statistical distribution, not a grade. It means your baby's weight, or length, or head circumference, is equal to or greater than 75% of babies the same age and sex in the WHO reference population. The other 25% weigh more.
The clinical normal range runs from the 3rd percentile to the 97th. The 75th sits in the upper portion of that range, well away from any threshold that triggers closer monitoring or intervention. There is no meaningful clinical difference between a baby at the 68th percentile and one at the 75th or 82nd. These are all normal positions on the same distribution, separated by the natural variation in healthy babies.
A reading parents sometimes misinterpret: the 75th percentile is not a target and not a better outcome than the 50th. A baby consistently at the 45th is following a healthy growth curve just as a baby at the 75th is. Percentile tells you where a baby sits relative to the reference population. Within the normal range, no position is healthier than another.
Weight, length, and head circumference are measured as three independent percentiles. A baby at the 75th for weight might be at the 55th for length and the 62nd for head circumference. Each is read on its own. When weight and length percentiles diverge significantly, the relationship between them becomes the more informative figure, which is covered in the final section.
How the 75th percentile maps to the clinical reference tiers:
| Percentile Range | Clinical Context |
|---|---|
| Below 3rd | Below the normal range, formal assessment threshold |
| 3rd to 10th | Low, more frequent trajectory monitoring |
| 10th to 25th | Below average, no intervention if trajectory is stable |
| 25th to 75th | Average range, 75th percentile sits at the top edge |
| 75th to 90th | Above average, still within normal |
| 90th to 97th | High end of normal, trajectory noted at visits |
| Above 97th | Above the normal range, closer evaluation recommended |
The 75th sits at the upper boundary of the wide average band. One step above it is still normal territory.
Reference Weights: What 75th Percentile Babies Weigh by Month
The WHO percentile curves are derived from the WHO Multicentre Growth Reference Study (MGRS), a study of 8,440 children across six countries followed from birth to age 5 under conditions representing optimal growth: breastfed for at least 12 months, non-smoking households, access to healthcare, and no nutritional deficiencies. The six countries included Brazil, Ghana, India, Norway, Oman, and the United States.
The MGRS was designed as a prescriptive standard: it shows how children grow under good conditions across a wide genetic range, not how children in one country happened to grow during one decade. This is why WHO charts replaced older country-specific charts in most pediatric settings.
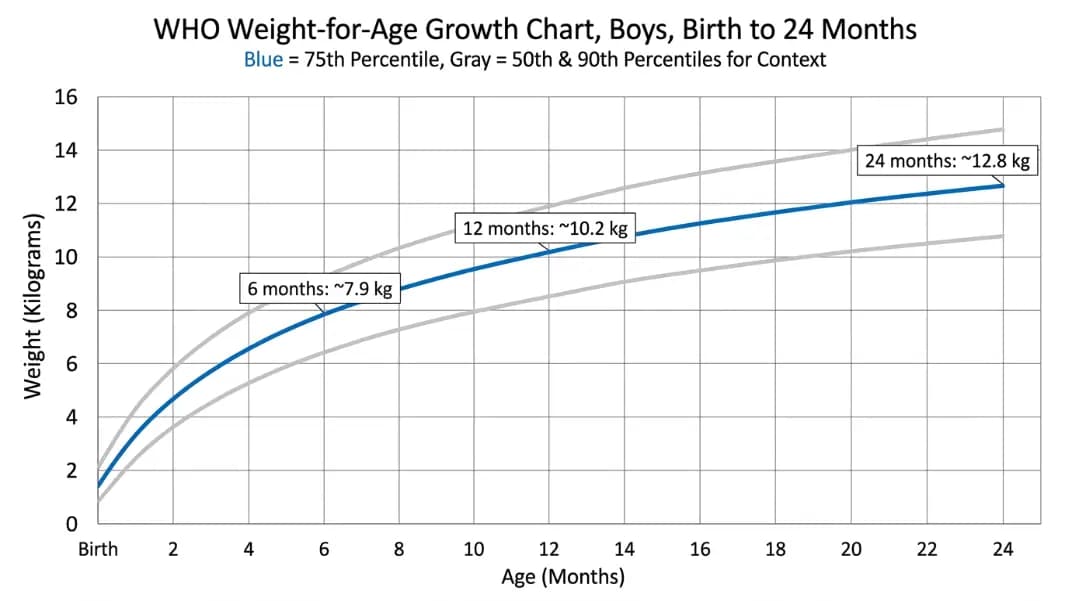
The 75th percentile line represents the upper edge of the average band in that reference population. A baby tracking along this line is growing in step with the healthiest upper quarter of the reference group.
The 50th Percentile Baby guide covers median reference values in detail. For comparison, 75th percentile babies run roughly 5 to 9% heavier than the median at any given age, with the gap widening slightly as babies get older.
Approximate WHO reference weights at the 75th percentile:
| Age | Boys 75th Percentile | Girls 75th Percentile |
|---|---|---|
| Birth | 3.5 kg (7.7 lbs) | 3.4 kg (7.5 lbs) |
| 3 months | 6.4 kg (14.1 lbs) | 5.8 kg (12.8 lbs) |
| 6 months | 8.2 kg (18.1 lbs) | 7.7 kg (17.0 lbs) |
| 9 months | 9.6 kg (21.2 lbs) | 9.0 kg (19.8 lbs) |
| 12 months | 10.5 kg (23.1 lbs) | 9.8 kg (21.6 lbs) |
| 18 months | 11.8 kg (26.0 lbs) | 11.0 kg (24.3 lbs) |
| 24 months | 13.1 kg (28.9 lbs) | 12.4 kg (27.3 lbs) |
A boy born at 3.5 kg who weighs 10.5 kg at 12 months has tracked the 75th percentile line closely. A boy born at 3.5 kg who weighs 12.0 kg at 12 months has moved above it. The values above show the expected curve; departure from that curve is what requires interpretation, not the curve itself.
Above Average vs. 97th Percentile: Where the Clinical Line Sits
The 97th percentile is the upper boundary of the standard clinical normal range. Above that threshold, pediatricians typically begin recommending closer monitoring at every visit: checking weight-for-length ratios, asking about feeding patterns in detail, and tracking whether the curve is still rising. The 75th percentile is 22 points below that boundary. These are not comparable clinical situations.
At the 90th percentile, a baby is above the average range but still within the unremarkable normal zone. Most pediatricians note the 90th in the chart without modifying the standard visit cadence or feeding guidance for a baby who has been stable at that position.
The shift in clinical attention begins around the 97th because crossing above it is associated with higher risk of remaining above it through childhood, and excess weight-for-length in infancy is one of the early indicators for childhood obesity risk assessment. None of this applies to a baby at the 75th.
Why BMI-for-age is not used under 24 months:
Pediatricians do not plot BMI-for-age for children under 2 years old. For infants, weight-for-length serves the same function: it shows whether a baby's weight is proportional to their height, which is more informative than weight relative to age alone. A baby at the 90th percentile for weight who is also at the 88th for length has a weight-for-length ratio that plots normally. A baby at the 90th for weight and the 30th for length has a weight-for-length ratio that plots much higher.
This is why a weight-for-age percentile alone, including a 75th or 90th reading, is not sufficient to draw conclusions about overweight risk in infants. The ratio is the meaningful number, not the weight percentile in isolation.
Growth Trajectory at the 75th: Stable vs. Rising Curves
Two babies both at the 75th percentile at a 9-month visit can have meaningfully different growth stories depending on where their previous readings sat.
A baby who measured at the 73rd at 6 months and the 76th at 9 months is demonstrating a stable curve. The small variation between visits is normal measurement noise, and the overall pattern is a baby tracking consistently along the 75th percentile line. That is exactly what a well-functioning growth chart shows.
A baby who measured at the 48th at 3 months, the 60th at 6 months, and the 75th at 9 months shows upward centile crossing across three consecutive visits. Upward crossing is discussed less often than downward crossing but follows the same clinical logic: a large position shift in a short period represents a change in growth rate that is worth understanding, even if the landing point is within the normal range.
What causes upward centile crossing:
The most common reason is normal genetic expression. Babies frequently shift toward their genetically determined percentile during the first 12 to 18 months. Birth percentile reflects the in-utero environment; the postnatal curve reflects both genetics and the feeding and growth environment after birth. Upward shifting toward a higher genetic setpoint is entirely normal.
Other contributors include switching from breastfeeding to formula, which is associated with faster weight gain in some infants, and introduction of solids before 4 to 6 months. In rare cases, consistent upward crossing with no clear explanation prompts a feeding assessment. Pediatricians interpret the trajectory in the context of the family's history and the baby's overall presentation, not the percentile reading alone.
A baby stable at the 75th from early infancy requires no explanation. It simply means this is where that baby's growth line sits.
The Baby Weight Percentile Chart by Age shows the full WHO reference tables with all major percentile lines labeled side by side, which makes it straightforward to track whether a baby's measurements are holding their line or shifting across visits.
Why Weight-for-Length Matters More Than Weight-for-Age at Higher Percentiles
Weight-for-age percentile is the number most parents focus on. The reading that provides more clinical context when a high weight percentile appears is weight-for-length: how a baby's weight compares to other babies of the same length, regardless of age.
A baby at the 75th percentile for weight and the 70th for length is growing proportionally. The weight-for-length chart would confirm a normal ratio. No additional note is needed in the clinical record beyond what is standard.
A baby at the 75th percentile for weight and the 28th for length carries substantially more weight relative to their body size than the weight-for-age reading suggests. On the weight-for-length chart, that baby may plot above the 90th or even 95th percentile. That is the reading that warrants discussion, not the 75th weight-for-age reading alone.
This relationship is not unique to above-average babies. It applies at every weight percentile. A baby at the 30th for weight and the 80th for length sits very lean on the weight-for-length chart, which is equally worth noting. The weight-for-length ratio is the primary tool for assessing whether a baby's weight is appropriate for their body size, and it is unavailable unless both measurements are taken and compared.
What to ask at the well-baby visit:
If your baby is at the 75th or higher for weight at a visit, the most complete picture comes from asking for three readings together:
- Weight-for-age percentile
- Length-for-age percentile
- Weight-for-length percentile
A 75th percentile baby with a proportional length and a normal weight-for-length ratio has no flags at any of those three readings. The clinical conversation there is straightforward: stable, healthy baby at the upper end of the normal range.
For parents whose baby is tracking below the average band, the contrast in clinical reasoning is covered in detail in the 30th Percentile Baby guide, which walks through centile crossing definitions, the 10th percentile threshold, and what stable below-average growth actually means at pediatrician visits.
Yes. The 75th percentile is within the clinical normal range, which runs from the 3rd to the 97th percentile on WHO growth charts. It means your baby weighs more than 75% of same-age babies in the reference population. Pediatricians do not flag a baby at the 75th percentile as overweight or as needing special monitoring. A baby consistently tracking near the 75th across multiple visits is demonstrating a stable, healthy growth curve that requires no intervention.
A baby at the 75th percentile for weight is heavier than 75% of babies the same age and sex in the WHO reference population. At 12 months, a boy at the 75th weighs approximately 10.5 kg (23.1 lbs) and a girl approximately 9.8 kg (21.6 lbs). These values are above the median but well within the normal range. A 75th percentile reading alone does not indicate overweight risk. That assessment requires weight-for-length, which compares weight to body size rather than to age.
The 70th percentile means your baby weighs more than 70% of same-age babies on the WHO growth chart. The 70th, 75th, and 80th percentiles are clinically indistinct from each other: all are above average, all sit within the normal range, and none triggers special monitoring for a baby with a stable trajectory. The same trajectory rule applies here as at any other percentile: a baby consistently near the 70th is healthy; a baby rapidly rising through the 70s across consecutive visits warrants a closer look at the rate of change.
The 97th percentile is the upper boundary of the standard normal range on WHO charts. Above that threshold, pediatricians typically check weight-for-length at every visit, ask about feeding patterns in more detail, and note whether the curve continues to rise. The 90th percentile is noted in the record but generally does not change the standard visit structure for a baby stable at that position. The 75th percentile is well below either threshold and does not trigger any change in monitoring frequency.
Both are above the median, but clinically they differ. The 75th percentile falls within the standard average zone and requires no special monitoring. The 97th is the upper boundary of the normal range, above which weight-for-length is evaluated at every visit and feeding patterns are reviewed more carefully. A baby at the 75th is 22 percentile points below that threshold. Above the 97th also receives closer attention because persistent high weight-for-length in infancy is one of the early signals associated with childhood obesity risk assessment, which is not a concern at the 75th.
No. A baby consistently at the 75th percentile is growing at a normal rate for their position on the chart. Restricting feeding to lower the percentile is not appropriate and not recommended by any major pediatric guideline. Feeding guidance for infants is based on hunger and satiety cues, not percentile targets. If the weight-for-length ratio is within the normal range and the trajectory is stable, feeding is appropriate for that baby. Any concerns about feeding volume should be raised with a pediatrician, who will assess weight-for-length rather than weight-for-age alone before offering any guidance.
Written by
Hassaan Rasheed
Web Developer & Content Researcher
Hassaan builds calculators and writes research-backed guides on finance, math, payroll, and construction topics. Every number in his articles is sourced from official data and worked through by hand.
View LinkedIn Profile