How to Calculate Cap Rate: Formula and Benchmarks (2026)
Cap rate = NOI divided by property value. Learn the formula, see examples by property type, and find out what cap rate benchmarks apply to your investment.
Cap rate is the first number serious real estate investors calculate before anything else. It tells you the unlevered income yield of a property, independent of how it is financed, and lets you compare deals of different types and sizes on a common basis. The Cap Rate Calculator runs this instantly. This guide covers the formula, NOI construction, benchmarks by property type, worked examples, and the specific situations where cap rate gives an incomplete picture.
How to Calculate Cap Rate: Formula and NOI Breakdown
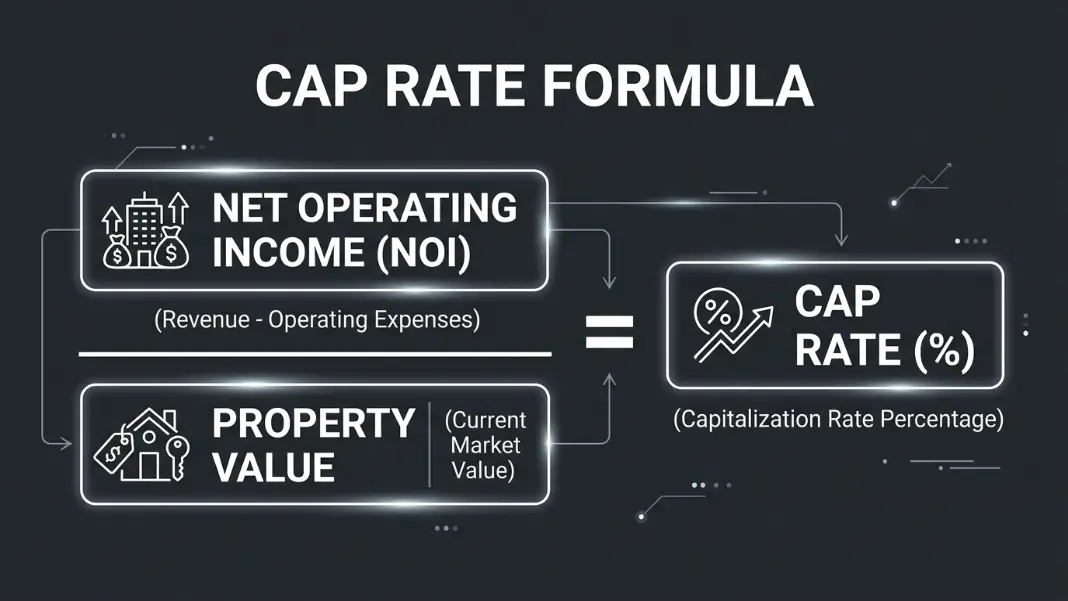
The cap rate formula is:
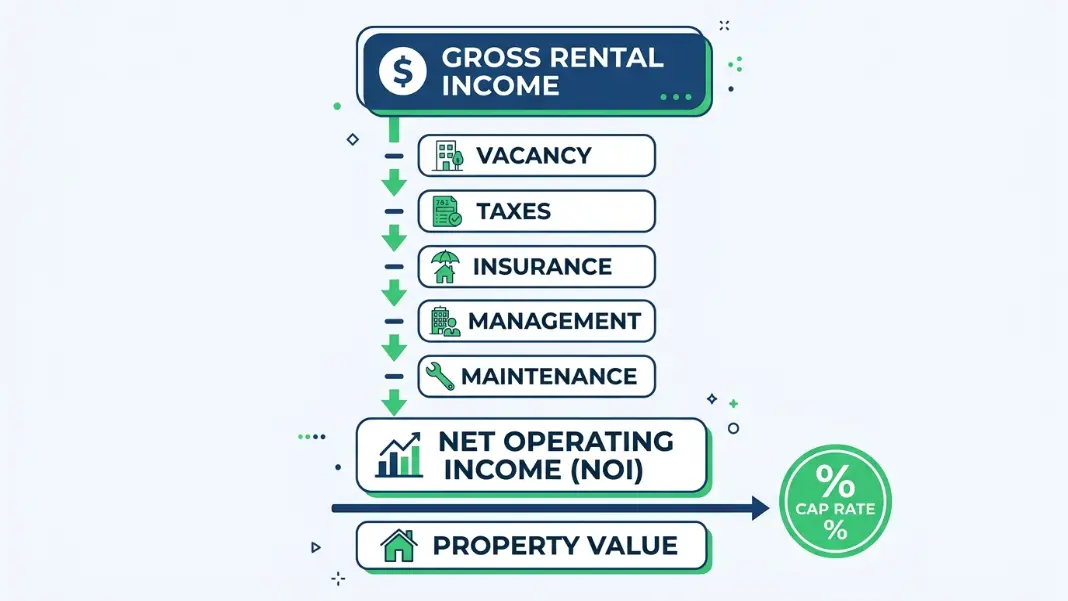
Cap Rate = Net Operating Income (NOI) / Current Property Value
The result is expressed as a percentage. NOI is gross rental income minus all operating expenses, before any debt service or income taxes.
What counts as an operating expense:
- Property taxes
- Property and liability insurance
- Property management fees (typically 8-12% of gross rents)
- Maintenance and repairs
- Owner-paid utilities
- Vacancy allowance (market standard: 5-10% of gross potential income)
What does NOT count as an operating expense:
- Mortgage principal and interest
- Depreciation
- Capital expenditures (roof, HVAC, parking lot resurfacing)
- Income taxes on net profit
The most common mistake in cap rate calculations is including the mortgage payment in operating expenses. Debt service belongs in the cash-on-cash return, not NOI. Cap rate is intentionally financing-neutral so you can compare properties regardless of how they are funded.
Worked example:
- Purchase price: $800,000
- Gross rental income: $72,000/year
- Vacancy allowance (6%): -$4,320
- Property taxes: -$8,400
- Insurance: -$2,800
- Property management (10% of effective income): -$6,768
- Maintenance and repairs: -$4,884
- NOI: $44,828
- Cap Rate: $44,828 / $800,000 = 5.6%
This 5.6% cap rate means the property generates $5.60 for every $100 of property value, before any debt service.
What Is a Good Cap Rate? Benchmarks by Property Type
A good cap rate depends entirely on the property type and market. Cap rates are risk premiums: a higher cap rate reflects a higher risk or a less liquid market. Investors in primary gateway cities accept lower yields because asset appreciation, liquidity, and tenant quality reduce overall risk.
Cap rate benchmarks by property type and market tier (2025-2026 data):
| Property Type | Primary Markets | Secondary Markets | Tertiary Markets |
|---|---|---|---|
| Class A Multifamily | 4.0-5.0% | 5.0-6.5% | 6.5-8.0% |
| Class B/C Multifamily | 5.5-7.0% | 6.5-8.5% | 8.0-10.0% |
| Retail (anchored strip) | 5.5-7.0% | 6.5-8.0% | 7.5-9.5% |
| Office (suburban) | 6.5-8.5% | 7.5-9.5% | 9.0-11.0% |
| Industrial / Logistics | 4.5-5.5% | 5.5-7.0% | 6.5-8.5% |
| Net Lease (single tenant) | 4.5-6.5% | 5.5-7.5% | 6.5-8.5% |
| Self Storage | 5.5-7.0% | 6.0-8.0% | 7.0-9.5% |
Primary markets include New York, Los Angeles, Chicago, San Francisco, Boston, and Seattle. Secondary markets include Denver, Austin, Nashville, Charlotte, Phoenix, and Atlanta.
A 5% cap rate in Manhattan is a normal stabilized deal. A 5% cap rate in a rural Midwest market likely signals either below-market rents, a strong tenant covenant on a NNN lease, or optimistic assumptions in the NOI. Always compare cap rate to local market benchmarks, not national averages.
Cap rates and interest rates move together. From 2020 to 2022, rates near zero compressed Class A multifamily cap rates to historic lows of 3.5-4.5% in gateway cities. Starting in 2023, rising rates forced cap rate expansion as buyers required higher yields to justify acquisitions over risk-free alternatives. From 2023 through 2025, buyers in most markets added 100-150 basis points to their cap rate requirements compared to the 2021 peak.
Cap Rate Calculation Examples: Residential and Commercial
Two practical examples at different scales illustrate how NOI construction affects the final cap rate.
Example 1: Small multifamily duplex
- Purchase price: $420,000
- Gross rent: $3,200/month × 2 units = $76,800/year
- Vacancy (5%): -$3,840
- Property taxes + insurance: -$7,200
- Property management (10%): -$7,296
- Maintenance and repairs: -$4,200
- NOI: $54,264
- Cap Rate: $54,264 / $420,000 = 12.9%
A 13% cap rate on a duplex signals one of several things: a B or C neighborhood with higher vacancy risk, deferred maintenance that has not yet hit the income statement, or below-market management expense assumptions. Before accepting this number, verify the vacancy allowance reflects actual local data and that capital expenditure needs are not buried in the maintenance line.
Example 2: Anchored retail strip center
- Purchase price: $2,100,000
- Gross rent (NNN leases, tenants pay operating expenses): $147,000/year
- Vacancy allowance (8%): -$11,760
- Landlord expenses (management, building insurance on shell): -$18,200
- NOI: $117,040
- Cap Rate: $117,040 / $2,100,000 = 5.57%
NNN (triple net) leases push most operating expenses to tenants, so the landlord NOI is cleaner and more predictable. These properties trade at lower cap rates than gross-lease equivalents because the income stream carries less volatility.
The duplex appears to offer more than twice the yield. That spread reflects the difference in management intensity, tenant quality, lease duration, and capital requirements. The duplex requires active management; the NNN retail center is largely passive. Investors pay for that predictability.
For how lenders structure financing around NOI, the Commercial Mortgage Calculator shows how debt service coverage ratio (DSCR) is calculated and what lenders require before approving a loan.
How Cap Rate Compression and Expansion Affect Property Value
Cap rate and property value move inversely. When cap rates compress (fall), the same NOI supports a higher property value. When cap rates expand (rise), values decline even if income is unchanged.
The relationship in formula form:
Property Value = NOI / Cap Rate
Impact of cap rate changes on the $44,828 NOI property from the first example:
| Cap Rate | Implied Value | Change from Base ($800k) |
|---|---|---|
| 4.0% | $1,120,700 | +$320,700 (+40%) |
| 4.5% | $996,222 | +$196,222 (+25%) |
| 5.0% | $896,560 | +$96,560 (+12%) |
| 5.6% (base) | $800,500 | baseline |
| 6.5% | $689,662 | -$110,338 (-14%) |
| 7.5% | $597,707 | -$202,293 (-25%) |
| 8.5% | $527,388 | -$272,612 (-34%) |
A 1.9 point increase in cap rate (from 5.6% to 7.5%) implies a 25% decline in property value with no change in income. This is the mechanism behind the commercial real estate write-downs seen broadly from 2022 to 2024 as rate hikes forced cap rate expansion. Borrowers who purchased at peak cap rate compression faced loan-to-value ratios that no longer supported refinancing.
Cap rate expansion also creates buying opportunities. When a property's current rents are below market and operating expenses are not optimized, a value-add buyer can increase NOI after acquisition. If they also benefit from cap rate stabilization or compression at exit, both the numerator (higher NOI) and the denominator effect (lower exit cap rate) work in their favor, compounding the equity return.
Where Cap Rate Falls Short
Cap rate answers one question well: what is the current unlevered income yield? Several important return drivers fall completely outside it.
Financing: Two properties with identical cap rates can produce very different cash-on-cash returns depending on the loan terms used. A 6% cap rate property financed with a 7.5% interest rate produces negative leverage. The debt costs more than the asset earns, and equity returns fall below the unlevered cap rate. A 6% cap with a 5.5% interest rate produces positive leverage.
Appreciation: Cap rate captures today's income relative to today's value. It says nothing about rent growth or value appreciation over the holding period. A 5% cap in a market with 3% annual rent growth compounds differently than a 7% cap in a flat market.
Capital expenditures: A property showing a 7% cap rate with a roof and HVAC replacement needed in year 2 will actually perform at 4-5% in the near term once capital costs are factored in. Buyers should normalize capital expenditures over the asset's useful life rather than treating them as one-time events.
Lease structure: A NNN lease at 5.5% cap and a gross lease at 5.5% cap carry very different income volatility. The gross lease landlord absorbs rising operating expenses; the NNN landlord does not.
For a full return picture that includes timing, leverage, and a modeled exit, IRR captures what cap rate cannot. The Cap Rate vs IRR comparison explains how experienced investors use both metrics together: cap rate for screening and market comparison, IRR for deal-level return modeling after debt and exit assumptions are defined.
Cap Rate = Net Operating Income (NOI) / Property Value. NOI is gross rental income minus operating expenses (vacancy, property taxes, insurance, management fees, maintenance) before debt service and depreciation. The result is expressed as a percentage. A $1,000,000 property with $60,000 NOI has a 6.0% cap rate. A higher cap rate means more income relative to price, but also typically higher risk or a less liquid market.
It depends on the market. In primary markets (New York, Los Angeles, Chicago), 4-5.5% is typical for stabilized multifamily. In secondary markets (Denver, Nashville, Atlanta), 5.5-7% is more common. In tertiary or rural markets, 7-10%+ is standard. Higher cap rates reflect higher risk, not simply better returns. A 10% cap in a shrinking market is not inherently better than a 4.5% cap in a high-growth primary market with 3% annual rent increases.
NOI = Gross Potential Income minus Vacancy Allowance minus Operating Expenses. Operating expenses include property taxes, insurance, property management fees (8-12% of gross rent), maintenance and repairs, and any landlord-paid utilities. Do not subtract mortgage payments, depreciation, or income taxes. For cap rate comparisons, capital expenditures are sometimes normalized by spreading their cost over the asset's useful life rather than deducting the full amount in the year incurred.
When cap rates rise, property values fall for the same NOI. The formula is: Value = NOI / Cap Rate. A property with $50,000 NOI at a 5% cap is worth $1,000,000. If the market cap rate moves to 7%, the same income supports only $714,286. That is a 29% value decline with no change in rental income. This is how rising interest rates translated directly into commercial real estate price compression from 2022 through 2024.
Cap rate measures the unlevered return on the full property value and ignores financing entirely. Cash-on-cash return measures annual pre-tax cash flow divided by the equity invested. A $1,000,000 property at a 6% cap purchased with a $750,000 mortgage produces a cash-on-cash return that depends on the loan's interest rate. If the rate is 5.5%, the investor gets positive leverage and a cash-on-cash above 6%. If the rate is 7%, they get negative leverage and a cash-on-cash below 6%.
Technically yes, but it is rarely useful for residential single-family. The cap rate on most single-family rentals is 4-7%, often lower than the financing cost, meaning the property cash flows negatively on a levered basis. Residential investors typically use gross rent multiplier or cash-on-cash return instead. Cap rate is most meaningful for commercial and multifamily properties where NOI can be compared across a consistent operating expense structure and investor transactions are income-driven rather than appreciation-driven.
Written by
Hassaan Rasheed
Web Developer & Content Researcher
Hassaan builds calculators and writes research-backed guides on finance, math, payroll, and construction topics. Every number in his articles is sourced from official data and worked through by hand.
View LinkedIn Profile