Gold to Silver Ratio Calculator: Formula, History, and How Investors Use It (2026)
Gold to silver ratio calculator: the formula, historical range from 1900 to today, how investors use it to time metal swaps, and why it expanded after 1971.
Most precious metal investors know the gold to silver ratio exists. Far fewer know what to do with it without making a costly mistake. The ratio gets thrown around in bullion forums and investment newsletters as though it's a clean timing signal, but the history of people acting on it tells a messier story. Understanding the ratio starts with knowing exactly what it measures, where it has been, and why the post-1971 world makes the ancient benchmarks far less useful than they look.
You can check today's melt values for silver using the Silver Calculator before reading further. This post covers the formula, the full historical record, and the rotation strategy that sounds straightforward in theory but costs people money in practice.
How the Gold to Silver Ratio Is Calculated
The formula is about as simple as financial ratios get.
Gold to Silver Ratio = Gold Spot Price / Silver Spot Price
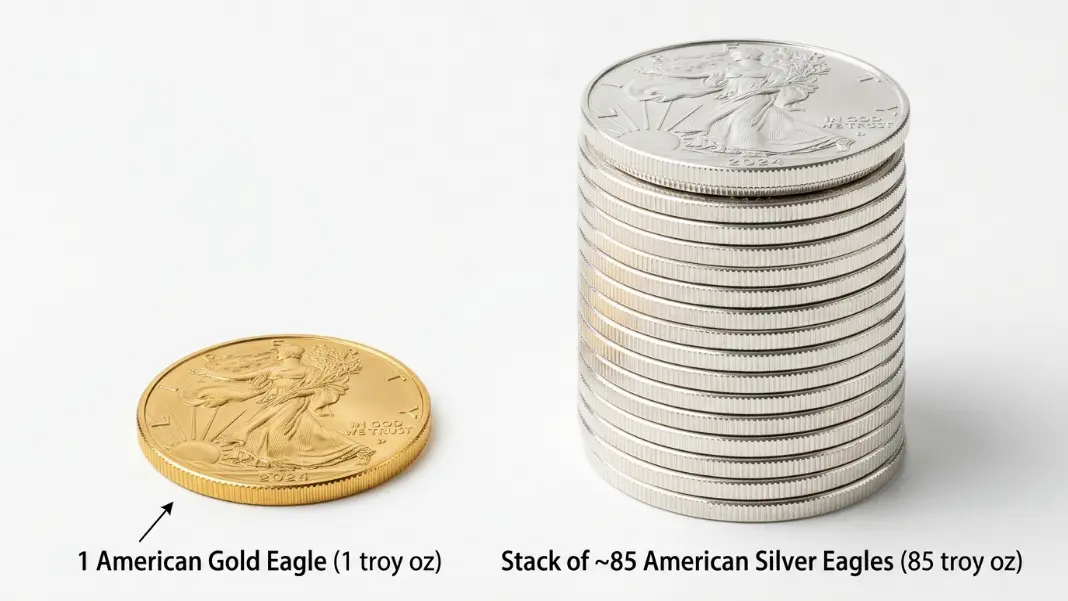
If gold is trading at $3,200 per troy ounce and silver is at $32 per troy ounce, the ratio is 100. That number means it takes 100 ounces of silver to buy 1 ounce of gold at current prices.
The ratio does not measure anything about quality, industrial demand, or future prices. It is a snapshot of relative pricing between the two metals at a single point in time.
Here are three worked examples at different price combinations. The table below shows how the ratio shifts as prices move.
| Gold Price ($/oz) | Silver Price ($/oz) | Gold to Silver Ratio |
|---|---|---|
| $2,400 | $30 | 80:1 |
| $3,200 | $32 | 100:1 |
| $3,000 | $50 | 60:1 |
Notice that the ratio can rise because gold gets more expensive, because silver gets cheaper, or both at the same time. That ambiguity matters when you are trying to interpret what a high ratio actually signals.
A ratio of 80 does not tell you whether silver is cheap or whether gold is expensive. You need additional context to make that call. That is where history comes in.
Gold to Silver Ratio History: From the Roman Empire to Today
The ratio has a documented history stretching back more than two thousand years, and the range has shifted dramatically depending on whether governments fixed it by law or markets set it freely.
Roman Empire: The Roman state legally fixed the ratio at approximately 12:1. This was a political and monetary decision, not a market outcome. Silver was abundant relative to gold, and the fixed rate reflected the practical logistics of currency production and trade across the empire.
United States Bimetallism: The Coinage Act of 1792 set the ratio at 15:1. A revision in 1834 adjusted it to roughly 16:1 to account for changes in mining output and trade flows. The US government was essentially setting the price relationship between the two metals as a matter of monetary policy, not letting markets find equilibrium.
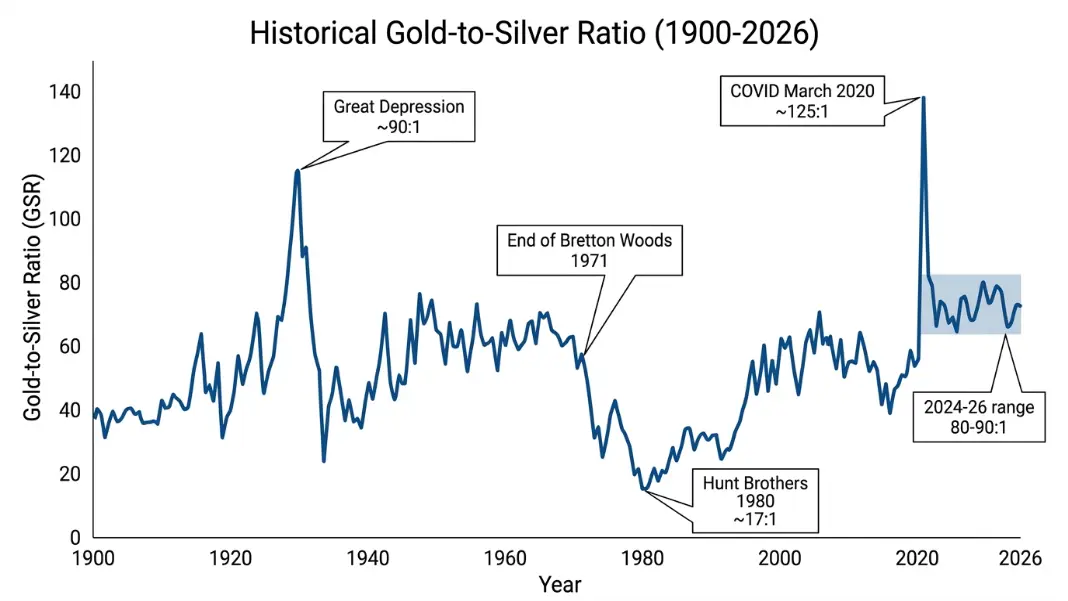
1900 to 1970: Once bimetallism gave way to gold-backed standards and eventually the Bretton Woods system, the ratio floated within a band of roughly 15:1 to 40:1. It spiked during the Great Depression as silver fell sharply in purchasing power terms, then settled into a more stable range through the mid-twentieth century.
1980 Silver Spike: The Hunt Brothers attempt to corner the silver market drove silver prices from around $6 to nearly $50 per ounce in a matter of months. At the peak, the ratio briefly fell to under 20:1, the lowest reading of the modern era. The collapse that followed was swift. Silver lost most of those gains within a year.
Post-1971 Drift: After the end of Bretton Woods in 1971, the ratio entered a new structural regime. The average across the 1980s, 1990s, and 2000s settled in the 55 to 65:1 range, roughly double the pre-war average. This shift was not random. The monetary role of silver declined faster than that of gold, which changed the demand dynamics underlying the ratio.
2020 COVID Panic: In March 2020, as markets sold everything liquid to raise cash, silver dropped sharply while gold held firmer. The ratio hit approximately 125:1, a reading with no historical precedent in recorded market data. It did not stay there long. Silver recovered aggressively through 2020, bringing the ratio back toward 70-75 by year end.
2024 to 2026: The ratio has traded in the 80 to 90:1 range. Silver has benefited from solar panel demand and electronics manufacturing, but gold's run above $3,000 has kept the ratio elevated relative to the post-war average.
The table below tracks the ratio at key historical moments.
| Date / Period | Approximate Ratio | Context |
|---|---|---|
| Roman Empire | 12:1 | Government-fixed |
| Coinage Act of 1792 | 15:1 | US bimetallism |
| 1834 US revision | 16:1 | Bimetallism adjustment |
| Great Depression peak | ~90:1 | Silver demand collapse |
| 1980 Hunt Brothers spike | ~17:1 | Silver price manipulation |
| 1990 average | ~65:1 | Post-Bretton Woods drift |
| March 2020 | ~125:1 | COVID liquidity panic |
| 2024-2026 range | 80-90:1 | Gold above $3,000 |
How Investors Use the Ratio to Decide Between Gold and Silver
The rotation strategy built around the ratio is simple to describe. When the ratio is historically high, above roughly 80, some investors sell gold and buy silver on the assumption that the ratio will revert toward its long-run average. When the ratio is historically low, below roughly 40, they do the opposite. The trade is expressed in ounce terms, not dollar terms.
Here is a worked example of how this plays out.
Starting position: You hold 1 troy ounce of gold. The ratio is 90:1. You sell the gold and buy silver. At 90:1, you receive 90 ounces of silver.
The reversion: The ratio moves from 90 back to 60:1, which is closer to the post-1971 average. You sell your 90 ounces of silver and use the proceeds to buy gold. At 60:1, 90 ounces of silver buys you 1.5 ounces of gold.
You have gone from 1 ounce of gold to 1.5 ounces of gold without any additional cash investment. If both metals rise in dollar terms over that period, your dollar gains are also amplified.
This logic is why the rotation strategy has a genuine following among bullion investors. The Silver Bar and Bullion Calculator can help you run the ounce math on your current holdings before you consider any swap.
The catch is that the worked example above glosses over several real-world problems. The reversion from 90 to 60 took roughly two years in the early 2010s. In 2020, the ratio spiked to 125 and then collapsed to 65 within about six months. In the 1990s, a high ratio sat stubbornly above 60 for years without reverting to historical norms.
Timing a reversion requires being right about both the direction and the duration. Most retail investors who rotate at the "right" ratio level still lose ground because they rotate back too early or too late.
Why the Ratio Expanded Dramatically After 1971
Before 1971, silver played a dual role in the global economy. It was both a monetary metal and an industrial input. Central banks held silver reserves. US coins contained silver until 1965. International trade settlements had at least indirect links to silver through various treaty arrangements. This kept a floor under silver's monetary value independent of its industrial applications.
When President Nixon ended the Bretton Woods system in August 1971, gold was officially demonetized from the fixed exchange rate system, but silver had already begun losing its monetary role faster. US silver coinage ended in 1965. Silver certificates stopped being redeemable in 1968. By 1971, silver's monetary demand had already been structurally reduced while gold retained more of its reserve asset status among central banks.
The Silver Price Per Ounce Explained article covers the mechanics of silver pricing in more detail, but the core point here is that after 1971, silver's price became increasingly driven by industrial demand rather than monetary demand.
Photography became a massive source of silver consumption through the 1970s, 1980s, and 1990s. When digital cameras replaced film in the 2000s, that demand category collapsed. Solar panel manufacturing and electronics have partially replaced it since then, but industrial demand behaves differently from monetary demand.
Industrial silver demand is cyclical and tied to manufacturing output, technology adoption rates, and commodity substitution. Gold's demand is primarily investment and central bank driven, which has a different volatility profile. When industrial economies slow down, silver tends to fall harder than gold, pushing the ratio higher. When growth accelerates, silver can rally faster, compressing the ratio.
This structural divergence explains why the pre-1971 ratio range of 15:1 to 40:1 is not a reliable anchor for modern investors. The underlying demand composition has changed too fundamentally for ancient benchmarks to carry much predictive weight.
The Ratio's Limitations as a Trading Signal
The ratio's biggest limitation is one that proponents rarely advertise: gold and silver respond to different demand drivers, and those drivers can stay out of sync for a long time.
Different demand profiles. Gold demand is approximately 40-50% jewelry, 30-40% investment and central bank, and the remainder industrial. Silver demand is over 50% industrial, with investment and jewelry making up the rest. A ratio of 90 might reflect a global manufacturing slowdown hitting silver hard, not silver being "cheap" relative to gold. Buying silver in that environment is a macro bet on industrial recovery, not a mean-reversion play.
The ratio can stay extreme for years. The 2020 spike to 125 is often cited as the clearest example of mean-reversion opportunity in recent memory. But even that example, which resolved quickly by historical standards, persisted for several weeks during which silver continued to fall. Investors who bought silver at 100:1 in late February 2020 watched it hit 125:1 before recovering. The psychological pressure to exit a losing position during that decline is not captured in the clean worked examples you see in investment articles.
In the 1990s, the ratio sat above 60 for most of the decade. Anyone waiting for a reversion to the 1970s norm of 40 waited for a very long time without a payoff.
Transaction costs and taxes destroy the theory. Here is a concrete example. Say you hold 1 ounce of gold purchased at $2,000. The current price is $3,000 and the ratio is 90:1. You decide to rotate into silver.
Selling 1 oz of gold at $3,000 triggers a taxable capital gain of $1,000 if held longer than a year, taxed at the long-term capital gains rate. At 15%, that is a $150 tax cost before you even buy silver. The dealer spread on selling gold and buying silver might add another 2-3% in total transaction friction, roughly $60-90 on a $3,000 position.
Your breakeven on the trade has already shifted. The ratio needs to move meaningfully in your favor just to recover those costs, let alone generate a real gain.
If the ratio moves from 90 to 85 and then you rotate back, you have paid taxes and spreads twice for a 5-point improvement in the ratio. The math rarely works as cleanly as the worked examples suggest.
Using the ratio as context for understanding relative valuation is reasonable. Using it as a systematic trading signal without accounting for the holding period, tax treatment, and spread costs has cost retail investors significant money. The IRR Calculator can help you model the actual return on a rotation trade after incorporating these costs over a realistic holding period.
The ratio is genuinely useful for understanding where we are historically in the gold-silver relationship. It is less useful as a standalone buy or sell signal.
The gold to silver ratio gives you a snapshot of where the two metals stand relative to each other, and the historical record shows it has spent most of the post-1971 era in the 55-90 range. When it moves well outside that band, it often does revert. But often and reliably are different things, and the timeline for reversion ranges from months to years.
The most honest framing: the ratio is a useful reference point when you are already planning to hold physical metals and want to think about allocation between gold and silver. It is a poor standalone timing mechanism for investors trying to generate alpha through swaps.
If you want to understand what your silver holdings are actually worth right now at current spot prices, the Silver Calculator handles the melt value side of the equation.
Divide the current gold spot price by the current silver spot price. If gold is $3,200 per troy ounce and silver is $32 per troy ounce, the ratio is 100. That number tells you how many ounces of silver it takes to buy one ounce of gold at current market prices. The calculation uses troy ounces for both metals.
The answer depends heavily on which period you use. Before 1971, the ratio averaged closer to 30-40:1 during free-market periods and was legally fixed at 12-16:1 during bimetallic monetary regimes. After 1971, the average shifted to approximately 55-65:1. Since 2000, it has averaged closer to 65-70:1, with brief spikes above 100 during market stress events.
A high ratio means gold is expensive relative to silver, or silver is cheap relative to gold. Ratios above 80 are generally considered elevated by post-1971 standards. Some investors interpret a high ratio as a signal that silver may outperform gold over the following months or years, though this reversion is not guaranteed and can take years to materialize.
The ratio hit approximately 125:1 in March 2020 during the COVID-19 market panic, the highest recorded reading in modern market history. Silver dropped sharply as investors sold liquid assets to raise cash, while gold held its value better. The ratio then collapsed rapidly as silver recovered through the second half of 2020, falling back toward 70-75:1 by year end.
A high ratio suggests silver is relatively cheap compared to gold on a historical basis, but it does not guarantee a reversion. The ratio can stay elevated for years. Before acting on it, consider the tax implications of any swap, dealer spreads on buying and selling physical metals, and the realistic holding period you can commit to. The trade works in theory more cleanly than it does in practice after costs.
As of mid-2026, the ratio is trading in the 80-90:1 range, reflecting gold prices above $3,000 per ounce and silver trading in the $32-40 range. This is elevated compared to the post-1971 average of 55-65, though not at the extremes seen in March 2020. Check a live metals pricing source for the current exact figure, as the ratio changes throughout every trading day.
Written by
Hassaan Rasheed
Web Developer & Content Researcher
Hassaan builds calculators and writes research-backed guides on finance, math, payroll, and construction topics. Every number in his articles is sourced from official data and worked through by hand.
View LinkedIn Profile