EFW Percentile in Pregnancy: Fetal Biometry, AC, and Growth Charts (2026)
EFW percentile in pregnancy: how estimated fetal weight is calculated from biometry measurements, and what low or high percentiles mean clinically.
EFW Percentile Calculator by Gestational Age
Enter the estimated fetal weight and gestational age shown on the scan report, then choose the matching EFW method.
Many scan reports calculate EFW with Hadlock using head circumference (HC), abdominal circumference (AC), and femur length (FL). Choose the original 2017 option only when the report uses the INTERGROWTH AC/HC EFW equation; mixing an EFW formula with a different reference curve can change the percentile.
On the selected Hadlock HC/AC/FL reference, an EFW of 1,119 g at 28 weeks corresponds to an estimated percentile of 49.9. EFW and percentile are estimates; clinicians interpret the scan, growth trend, and clinical context together.
| 10th percentile | 50th percentile | 90th percentile |
|---|---|---|
| 982 g | 1,119 g | 1,279 g |
Sources: INTERGROWTH-21st Hadlock EFW standard (2020) and the original INTERGROWTH EFW standard (2017). The equations are evaluated at exact weeks plus days; values are not linearly interpolated. Reference tool only — not medical advice.
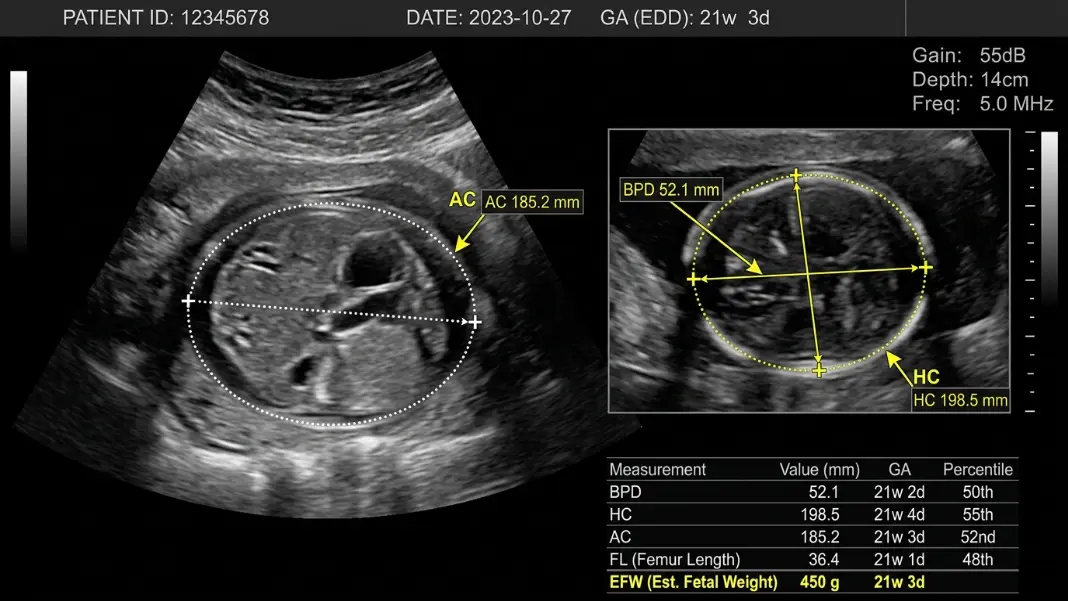
The EFW percentile in pregnancy is one of the most referenced numbers in prenatal monitoring, and one of the most misread. EFW stands for estimated fetal weight, and the value is not directly measured. It is a calculated estimate derived from ultrasound measurements of specific body parts, run through a formula. The percentile next to it places that estimate within a reference population at the same gestational age.
Two fetuses at the 28th percentile are not necessarily in the same situation if one has been near that curve on serial scans and the other has a changed trajectory. The number alone does not carry that context. Use the calculator above with the EFW and exact gestational age from the scan report, and match its reference option to the EFW equation used by the imaging unit.
This guide covers how EFW is estimated, what each biometry measurement contributes, INTERGROWTH-21st reference values by week, why abdominal circumference gets separate clinical attention, and what low or high percentiles indicate in practice.
What EFW Percentile Is and How Ultrasound Estimates Fetal Weight#
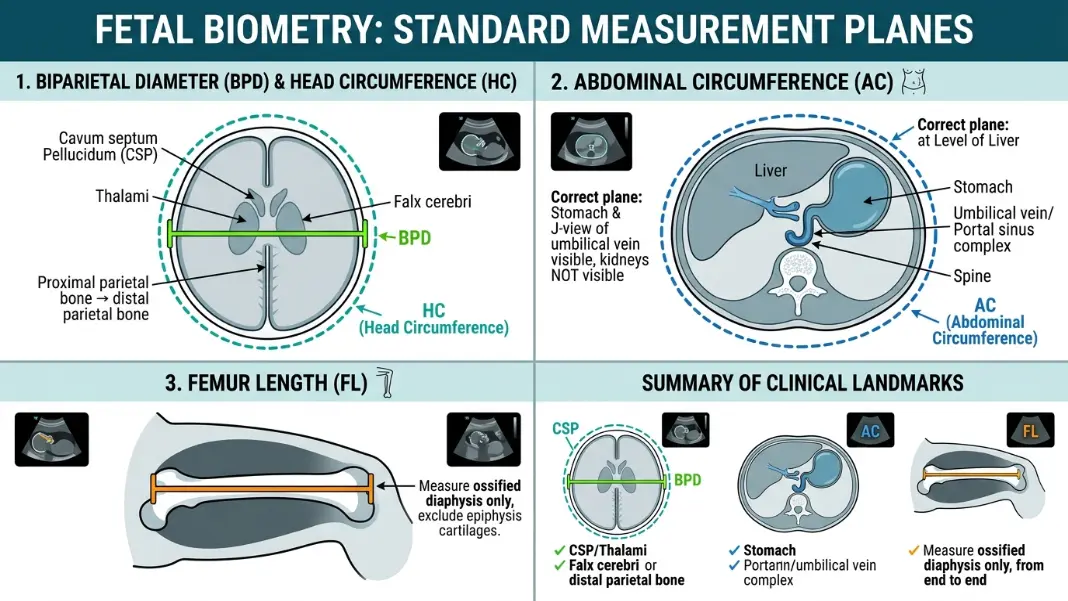
EFW is calculated from ultrasound biometry using a regression equation. One widely used Hadlock variant takes head circumference (HC), abdominal circumference (AC), and femur length (FL):
log10(EFW) = 1.326 + 0.0107 × HC + 0.0438 × AC + 0.158 × FL - 0.00326 × AC × FL
In that equation HC, AC, and FL are in centimeters; raising 10 to the result gives EFW in grams. Other equations use different measurements and coefficients. This calculator does not recompute EFW from raw biometry—it accepts the grams already printed on the scan report.
The percentile:
Once EFW is calculated, a separate gestational-age reference curve turns that gram estimate into a percentile. P40 means the EFW plots above 40% of that modeled distribution. P10 and P90 are commonly used size thresholds, but the middle band does not guarantee normal growth or outcome.
The reference and EFW equation must be identified separately. This tool defaults to the 2020 INTERGROWTH-21st Hadlock-specific standard, developed for EFW calculated with Hadlock's HC/AC/FL equation and valid from 24 to 43 weeks. The alternate 2017 original INTERGROWTH-21st standard was paired with INTERGROWTH's AC/HC EFW equation and is valid from 22 to 40 weeks. Comparing a Hadlock-reported EFW with the original AC/HC curve is not methodologically equivalent.
Accuracy margin:
EFW has meaningful uncertainty, often summarized clinically as roughly ±15% and sometimes more at the extremes. A reported 1,500 g is therefore an estimate, not a scale measurement. Biometry technique, fetal position, operator variation, and the equation used all contribute, so clinicians interpret the number with the wider scan and pregnancy context.
The Four Biometry Measurements: BPD, HC, AC, and FL#
Each measurement targets a different structure, reflects different aspects of growth, and diverges from the others in different clinical scenarios. Understanding what each one represents explains why the percentile on an individual measurement sometimes matters as much as the composite EFW.
BPD: Biparietal Diameter
BPD measures the width of the fetal skull at its widest cross-section, from one outer surface to the other. It was historically central to gestational age dating before detailed anatomy scans became standard, reliable from about 12 weeks. BPD is now less central to EFW formulas than HC because skull circumference captures head geometry more completely, particularly in fetuses with non-round skull shapes. Dolichocephaly (elongated skull) and brachycephaly (flattened skull) affect BPD meaningfully but not HC. BPD remains a standard scan measurement and is included in many EFW formulas alongside HC.
HC: Head Circumference
HC measures the perimeter of the outer skull and is less sensitive than BPD to head-shape variation. A clinician interprets an HC that differs from other parameters with gestational age, anatomy, repeat measurements, and the rest of the scan; the pattern alone does not establish a cause.
AC: Abdominal Circumference
AC measures the fetal abdomen in a standardized transverse plane and contributes strongly to common EFW equations. It is also assessed independently: SMFM includes AC below P10 in its recommended sonographic definition of FGR. A low AC can occur in placental insufficiency, but the measurement alone does not identify the cause.
A high AC may be seen with accelerated fetal growth, including in some pregnancies affected by diabetes, but it is not a diagnostic test for gestational diabetes or macrosomia by itself.
FL: Femur Length
FL measures the femoral shaft and contributes to several EFW equations. An FL that differs from the other measurements can reflect dating, constitutional size, measurement variation, or a clinical condition. The full anatomy, degree of difference, interval change, and family context determine whether further assessment is needed.
For a broader overview of how these parameters map to clinical decisions at each trimester scan, the Baby Percentile During Pregnancy guide covers the trimester-by-trimester interpretation framework and what changes in percentile across scans indicate.
EFW Percentile by Gestational Week: 2020 Hadlock-Specific Reference#
The table below is generated from the published LMS equations for the 2020 INTERGROWTH-21st standard paired with Hadlock HC/AC/FL EFW. Values are rounded to the nearest gram. The equations support exact gestational age from 24 to 43 weeks; selected whole-week rows are shown here.
| Gestational Week | 10th Percentile | 50th Percentile | 90th Percentile |
|---|---|---|---|
| 24 weeks | 559 g | 630 g | 714 g |
| 26 weeks | 751 g | 851 g | 968 g |
| 28 weeks | 982 g | 1,119 g | 1,279 g |
| 30 weeks | 1,252 g | 1,435 g | 1,649 g |
| 32 weeks | 1,556 g | 1,795 g | 2,072 g |
| 34 weeks | 1,885 g | 2,189 g | 2,538 g |
| 36 weeks | 2,228 g | 2,602 g | 3,031 g |
| 38 weeks | 2,569 g | 3,017 g | 3,527 g |
| 40 weeks | 2,888 g | 3,409 g | 3,999 g |
| 42 weeks | 3,166 g | 3,753 g | 4,417 g |
| 43 weeks | 3,283 g | 3,899 g | 4,595 g |
Source: Stirnemann et al., Ultrasound in Obstetrics & Gynecology (2020). A clinical unit may use a different equation or chart, so its report can legitimately show different centiles.
At 28 weeks on this specific standard, P10 is about 982 g, P50 about 1,119 g, and P90 about 1,279 g. These values must not be mixed with a table based on the original 2017 AC/HC equation or another chart. A percentile is not a performance score.
Growth velocity across scans:
A single percentile from one scan is less informative than the trajectory across two or three scans. A fetus consistently tracking at the 15th percentile across all scans has a different clinical picture from one that measured at the 50th percentile at 24 weeks, 35th at 28 weeks, and 15th at 32 weeks, even though both are at the 15th percentile at the most recent scan. The drop in percentile points over time, known as growth deceleration, is what triggers closer monitoring rather than the absolute percentile position alone.
Gestational age accuracy also affects where a baby falls on the chart. An EFW that appears low partly because the pregnancy dates are off by 10 days looks significantly different once dates are corrected. When gestational age is uncertain, early first-trimester dating by crown-rump length is the most accurate reference, and later scan measurements are interpreted against that date.
For reference values used after birth, the Baby Weight Percentile Chart by Age covers WHO growth standards by sex and age in months, which differ from the prenatal reference charts.
AC Percentile in Pregnancy: Why Abdominal Circumference Gets Separate Attention#
Most scan reports show individual percentiles for each biometry measurement alongside the composite EFW percentile. Among the individual measurements, AC carries specific clinical significance that the other three do not carry in the same way.
Why AC diverges first in growth restriction:
In some placental-insufficiency patterns, abdominal growth is affected more than head growth. Doppler can add information about placental resistance and fetal adaptation. Neither the AC/HC pattern nor a single Doppler result proves a cause by itself.
Terms such as “asymmetric growth” describe differing biometry patterns, not a standalone diagnosis. AC at P8 with HC at P40 and an abnormal umbilical-artery Doppler would be interpreted differently from the same measurements with reassuring surveillance, but only the treating team can integrate those findings.
Clinical response to low AC percentile:
The SMFM FGR guidance recommends defining FGR as EFW or AC below P10. Surveillance and delivery timing then depend on gestational age, EFW severity, umbilical-artery Doppler, maternal conditions, and other findings; this article cannot assign a schedule from AC alone.
High AC percentile:
AC above P90 is an upper-tail size result, not a gestational-diabetes test. The prenatal team interprets it with the composite EFW, diabetes screening, amniotic fluid, trajectory, and other findings.
When AC differs substantially from the other measurements, ask the prenatal team how they interpret the pattern and whether dating, repeat biometry, Doppler, or other information changes the assessment.
What Low and High EFW Percentiles Mean Clinically#
EFW percentile is a screening parameter, not a diagnosis. Its value is in identifying which pregnancies need more assessment, not in determining outcomes on its own.
Below the 10th percentile: SGA and FGR
SGA is a statistical size description generally based on a value below P10 for gestational age; prenatal and birth-weight terminology can differ. It does not identify the cause.
For prenatal ultrasound, SMFM recommends defining FGR as EFW or AC below P10. Growth velocity, umbilical-artery Doppler, gestational age, maternal conditions, and other findings refine risk and management.
Management cannot be inferred from the percentile alone. Abnormal umbilical-artery Doppler, especially absent or reversed end-diastolic flow, changes surveillance and delivery considerations, but those decisions are individualized.
Below the 3rd percentile:
SMFM calls EFW below P3 severe FGR and provides specific surveillance and delivery recommendations that also depend on Doppler and gestational age. Use the linked guideline or treating maternal-fetal-medicine team rather than a generic percentile rule.
Above the 90th percentile: LGA and macrosomia
LGA generally means size above P90 for gestational age. Macrosomia instead uses an absolute weight threshold, commonly 4,000 g or 4,500 g depending on the source and context. An ultrasound EFW near either threshold still carries estimation uncertainty.
The clinical response to LGA depends on context. An isolated 92nd percentile EFW with no diabetes history, normal amniotic fluid, and proportionate biometry is monitored differently from a 96th percentile EFW with a disproportionately enlarged AC in a pregnancy with gestational diabetes. The etiology, not just the number, shapes the management decision.
Serial tracking above everything:
A change from P60 to P25 and repeated estimates near P12 are different patterns, but this article cannot rank their risk from percentile alone. Clinicians review interval growth, measurement uncertainty, dating, Doppler, and other findings in both situations.
For the statistical framework behind percentile interpretation and how the same percentile number is read differently before and after birth, the What Does Baby Percentile Mean guide covers the reference standards, normal variation, and how clinicians use growth charts across the full age range.
EFW percentile is the position of an ultrasound-estimated weight on a gestational-age reference curve. The EFW equation and percentile curve are separate: for example, Hadlock HC/AC/FL biometry can produce the grams, and the matching 2020 INTERGROWTH-21st curve can convert those grams to a percentile.
P10 and P90 are commonly used lower and upper size thresholds, but the middle band does not guarantee a normal outcome. SMFM recommends defining sonographic FGR as EFW or AC below P10. Chart choice, measurement uncertainty, growth velocity, Doppler, gestational age, and other findings determine what any result means.
AC percentile is the abdominal-circumference measurement's position on a gestational-age chart. AC contributes strongly to common EFW equations, and SMFM includes AC below P10 in its FGR definition. A low AC does not by itself prove placental insufficiency or another cause.
Ultrasound EFW has meaningful uncertainty, often summarized clinically as roughly ±15% and sometimes more at the extremes. It should not be treated as a direct scale weight. Biometry technique, fetal position, operator variation, and the equation used all contribute.
SGA generally describes size below P10 for gestational age and does not identify the cause. For prenatal ultrasound, SMFM recommends defining FGR as EFW or AC below P10 and calls EFW below P3 severe FGR. Doppler, growth velocity, gestational age, and the wider clinical picture guide management.
EFW is calculated from ultrasound biometry; birth weight is measured on a scale after delivery. They can differ because of EFW uncertainty and growth between scan and birth. A prenatal percentile and postnatal WHO percentile also use different reference methods, so they should not be expected to match exactly.
Written by
Hassaan Rasheed
Web Developer & Content Researcher
Hassaan builds calculators and writes source-linked guides across the site's subject areas. Calculator methods and reference data are documented in each guide so readers can verify the underlying sources.
About the author and methods