A1C Calculator: Blood Glucose Conversion, Formula, and Chart (2026)
A1C calculator: convert average blood glucose or GMI to estimated A1C using the ADA ADAG formula. mg/dL and mmol/L both supported. Free, no signup.
Your continuous glucose monitor shows an average glucose of 154 mg/dL over the past 90 days. Your doctor will ask for your A1C at the next appointment. These two numbers describe the same underlying picture from different angles, and converting between them uses a single formula. The A1C Calculator runs the conversion for any average blood glucose in mg/dL or mmol/L, including a direct GMI-to-A1C path for CGM users.
The ADA's ADAG formula is the standard for estimating A1C from average blood glucose. It was derived from a 2008 study that measured both values in the same patients across multiple months, producing a reliable linear relationship. For most people, the estimated A1C from this calculator falls within 0.5 percentage points of a laboratory result, though several physiological factors can push them further apart.
The ADA ADAG Formula: How Average Glucose Maps to A1C
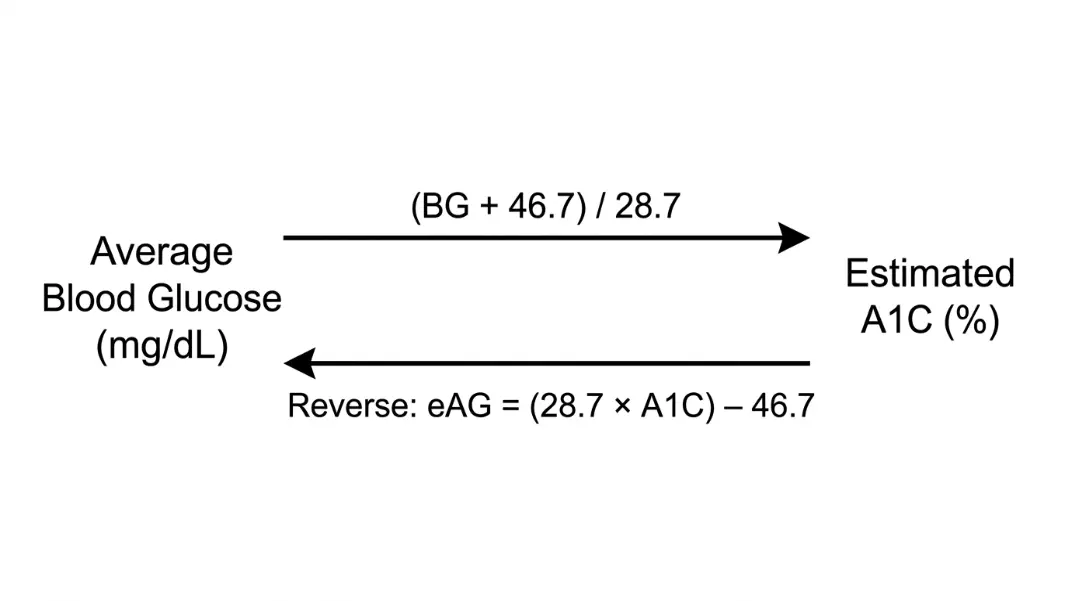
The American Diabetes Association's A1C-Derived Average Glucose (ADAG) formula converts average blood glucose to estimated A1C:
Estimated A1C (%) = (Average Glucose mg/dL + 46.7) / 28.7
In reverse (A1C to estimated Average Glucose):
eAG (mg/dL) = (28.7 × A1C) - 46.7
In mmol/L:
Estimated A1C (%) = (Average Glucose mmol/L + 2.59) / 1.59
eAG (mmol/L) = (1.59 × A1C) - 2.59
Worked example: average glucose of 126 mg/dL
A1C = (126 + 46.7) / 28.7
A1C = 172.7 / 28.7
A1C = 6.02%
An average of 126 mg/dL corresponds to an estimated A1C of about 6.0%.
Worked example: A1C of 7.5% back to average glucose
eAG = (28.7 × 7.5) - 46.7
eAG = 215.25 - 46.7
eAG = 168.55 mg/dL
An A1C of 7.5% reflects an average daily glucose of roughly 169 mg/dL.
Blood Glucose to A1C in Both Directions: mg/dL and mmol/L
The calculation is a single arithmetic step, but the input needs to be a true average over 60–90 days. A single fasting reading is not an appropriate input.
What counts as a reliable average glucose:
- A 90-day CGM average from your device or app (most reliable)
- Multiple fasting glucose readings averaged over at least 60 days
- A 30-day average if 90 days is not available (less precise, wider margin of error)
Step-by-step for any average glucose in mg/dL:
- Take your average blood glucose value
- Add 46.7
- Divide by 28.7
- Round to one decimal place
For an average of 182 mg/dL:
Step 1: 182 + 46.7 = 228.7
Step 2: 228.7 / 28.7 = 7.97%
Result: approximately 8.0% A1C
Converting mmol/L: Multiply mmol/L by 18.016 to get mg/dL, then apply the formula above. Alternatively, use the mmol/L version directly: A1C = (mmol/L + 2.59) / 1.59.
For 10.1 mmol/L: (10.1 + 2.59) / 1.59 = 12.69 / 1.59 = 7.98%, which matches the mg/dL result for 182 mg/dL.
GMI to A1C: What Continuous Glucose Monitors Report
Glucose Management Indicator (GMI) is the estimated A1C that CGM apps display, calculated from sensor glucose data using the ADAG formula as its basis.
GMI (%) = 3.31 + 0.02392 × Mean Glucose (mg/dL)
This simplified linear approximation derives from the ADAG relationship. For most people, GMI and laboratory A1C agree within 0.3 percentage points. Individual variation can run wider.
Why CGM apps say GMI rather than A1C: The FDA requires device manufacturers to distinguish sensor-derived estimates from laboratory A1C values. The two measure the same underlying quantity through different methods. CGMs measure interstitial glucose continuously; the lab test measures glycated hemoglobin directly from blood. The terminology differs by measurement method, not by clinical meaning.
For people with haemolytic anaemia or other conditions affecting red blood cell turnover, CGM-derived GMI may actually be more representative of true glucose exposure than laboratory A1C. The lab test is influenced by how long red blood cells survive; the CGM is not.
The Health & Fitness Calculators section includes the A1C tool alongside other clinical calculators for body composition, corrected calcium, and cardiovascular metrics.
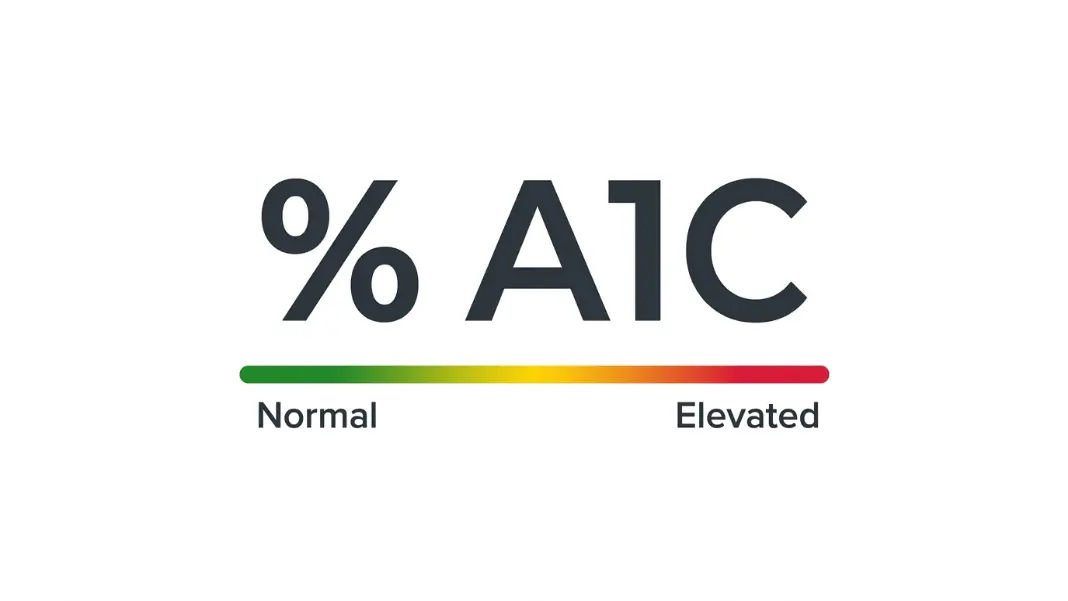
A1C Reference Chart: Ranges and What the Numbers Mean
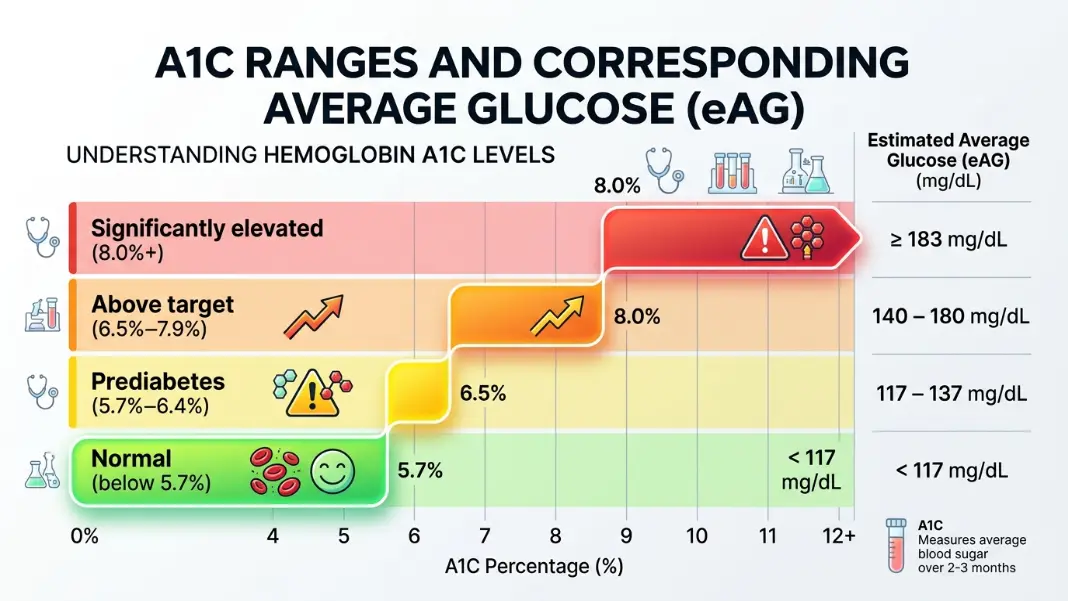
The ADA defines the following diagnostic and management categories:
| A1C Range | Category |
|---|---|
| Below 5.7% | Normal |
| 5.7% to 6.4% | Prediabetes |
| 6.5% and above | Diabetes (diagnostic threshold) |
| Below 7.0% | ADA management target for most adults with diabetes |
| 7.0% to 8.0% | Above ADA target |
| Above 8.0% | Significantly elevated |
Corresponding average blood glucose at each A1C level:
| A1C | Average Glucose (mg/dL) | Average Glucose (mmol/L) |
|---|---|---|
| 5.0% | 97 | 5.4 |
| 5.7% | 117 | 6.5 |
| 6.0% | 126 | 7.0 |
| 6.5% | 140 | 7.8 |
| 7.0% | 154 | 8.6 |
| 7.5% | 169 | 9.4 |
| 8.0% | 183 | 10.2 |
| 9.0% | 212 | 11.8 |
| 10.0% | 240 | 13.4 |
These values are based on the ADAG formula. Individual A1C targets set by a doctor may differ from the ADA general guidelines, particularly for older adults or those with a history of hypoglycaemia.
Why Your Estimated A1C May Differ from Your Lab Result
The ADAG formula produces a close estimate for most people, but certain physiological factors cause consistent divergence.
Haemoglobin variants. Some haemoglobin variants, including HbS, HbC, and HbE, interfere with standard lab assays. The ADAG formula assumes normal HbA. People with variants may receive A1C readings that are systematically higher or lower than their actual glucose exposure. If you have sickle cell trait or another variant, discuss which assay method your lab uses with your doctor.
Red blood cell lifespan. A1C reflects glucose exposure across the full lifespan of red blood cells, typically 90–120 days. Conditions that shorten RBC lifespan, including haemolytic anaemia, iron-deficiency anaemia, and recent blood transfusions, lower the A1C reading relative to actual average glucose. Extended RBC lifespan has the opposite effect.
Glycation variability. Some people's red blood cells glycate at faster or slower rates than average for a given glucose level. This is individual and not adjustable through the formula.
If your lab A1C is consistently 0.5% or more away from the ADAG estimate, it is worth raising with your doctor. A similar principle applies in the Corrected Calcium Calculator, where a standard reference range must be adjusted for individual serum albumin levels before the result is clinically meaningful.
Lab A1C vs CGM-Derived GMI: Which Number to Trust When They Diverge
When a lab A1C and a CGM-derived GMI disagree by more than 0.5 percentage points, the question is which one reflects your true glucose exposure.
The lab test measures glycated haemoglobin directly from blood. It reflects red blood cell exposure over 90–120 days, weighted toward the most recent weeks because newer cells are more prevalent. The GMI calculates an estimate from continuous interstitial glucose readings over your CGM wear period, whether that is 14, 30, or 90 days.
When GMI is likely more accurate:
Haemoglobin variants — HbS, HbC, HbE — interfere with standard lab assays, producing A1C readings that are systematically too high or too low for that person. Haemolytic anaemia, iron-deficiency anaemia, and recent blood transfusions shorten red blood cell lifespan, which lowers lab A1C below what actual glucose exposure would predict. In these cases the GMI, which is based on direct glucose measurements rather than haemoglobin chemistry, gives a better picture.
When lab A1C is likely more accurate:
A CGM wear period shorter than 90 days introduces more noise. A 14-day GMI can swing significantly based on a single difficult week. Sensor calibration gaps and days without the device mean the average is calculated from incomplete data. Lab A1C, taken from a blood draw, does not depend on consistent sensor wear.
For clinical decisions — medication changes, diagnostic thresholds, insurance coverage — doctors use lab A1C, not GMI. The GMI is most useful for your own tracking between appointments and for identifying whether your physiology consistently diverges from what the ADAG formula predicts.
When both values agree within 0.3 percentage points, each method is confirming the other. That agreement is the most useful signal: it means the estimate is reliable and neither the haemoglobin chemistry nor the CGM data is introducing systematic error.
The Corrected Calcium Formula guide covers a similar principle: a population-based clinical formula that requires individual adjustment when physiology pushes the result outside the standard range.
Use the ADA ADAG formula: A1C (%) = (Average Glucose mg/dL + 46.7) / 28.7. Take your 60–90 day average blood glucose, add 46.7, and divide by 28.7. For example, an average of 154 mg/dL gives (154 + 46.7) / 28.7 = 6.99%, approximately 7.0%. The A1C Calculator runs this in both mg/dL and mmol/L with the reverse conversion included.
GMI (Glucose Management Indicator) is an estimated A1C calculated by a CGM device from continuous sensor data. A1C is a laboratory test measuring glycated hemoglobin directly from a blood sample. Both describe average glucose exposure using the same underlying ADAG relationship. They typically agree within 0.3 percentage points. Conditions affecting red blood cell lifespan or haemoglobin variants can cause larger differences between the two.
The ADA diagnostic threshold for diabetes is an A1C of 6.5% or higher, confirmed on two separate tests. A1C between 5.7% and 6.4% indicates prediabetes. Below 5.7% is considered normal. For people already diagnosed with diabetes, the ADA management target for most adults is below 7.0%, though individual targets set by a doctor may vary based on age, health history, and hypoglycaemia risk.
No. The A1C formula requires an average over 60–90 days, not a single reading. A single fasting or post-meal glucose reflects conditions at one moment: stress, recent food, illness, or time of day. Using it as input produces a misleading estimate. A 90-day CGM average or multiple fasting readings averaged over at least 60 days gives a reliable input for the ADAG formula.
eAG (estimated Average Glucose) is the reverse conversion: it expresses an A1C percentage in mg/dL or mmol/L. The formula is eAG = (28.7 × A1C) - 46.7 in mg/dL. An A1C of 7.0% equals an eAG of 154 mg/dL. Some lab reports now print eAG alongside A1C specifically to translate the percentage into units patients can compare against their daily meter or CGM readings.
The most common causes are haemoglobin variants (HbS, HbC), which interfere with standard assays, and conditions that alter red blood cell lifespan. Haemolytic anaemia, iron deficiency, and recent transfusions all shorten RBC lifespan and lower the lab A1C relative to actual glucose exposure. Individual glycation rates also vary. A divergence of 0.5% or more that repeats across multiple tests is worth discussing with a doctor.
Written by
Hassaan Rasheed
Web Developer & Content Researcher
Hassaan builds calculators and writes research-backed guides on finance, math, payroll, and construction topics. Every number in his articles is sourced from official data and worked through by hand.
View LinkedIn Profile